


Pathway Tools by SRI |
SRI International offers innovative tools for modeling and analyzing genomes, metabolic pathways, and regulatory networks to support activities in drug discovery, agriculture, and biotechnology. These tools accelerate research and lead to a greater understanding of biological systems. SRI's unique Omics Viewers support visualization and analysis of large omics datasets on genome-scale cellular network diagrams. BioCyc and Pathway Tools are freely available for academic research.
The BioCyc database collection from SRI International is a set of 1,100 Pathway/Genome Databases (PGDBs) for many sequenced genomes. PGDBs describe the entire genome of an organism, as well as its biochemical pathways and (when curated) its regulatory network. New expanded releases occur twice per year. Two members of the BioCyc collection, the EcoCyc and MetaCyc databases, are derived from more than three decades of literature-based curation of genome and pathway data. The HumanCyc database provides a unique collection of human metabolic pathway data. The downloadable Pathway Tools software and BioCyc databases provide many capabilities not present on the BioCyc.org Web site.
BioCyc Introductory Tutorial
Watch additional BioCyce Tutorials here.
Pathway Tool Software
Pathway Tools provides a powerful and comprehensive set of features for querying, visualization, analysis, and curation of the BioCyc database collection. Pathway Tools combines representation and inference techniques from artificial intelligence to extract additional information from genomes, and encode that information within a sophisticated ontology. Pathway Tools can operate on the BioCyc collection of PGDBs available through SRI, and on locally created PGDBs, such as for proprietary genomes. It can also operate on more than 1,700 PGDBs created by third parties, including those listed in SRI's Registry of Pathway/Genome Databases at http://biocyc.org/registry.html.
To date, SRI has licensed Pathway Tools to more than 3,000 academic and industrial groups.
"Pathway Tools is a valuable component of our systems biology toolbox. The software allows me to integrate and visualize various types of omics data within the context of the metabolic network for the bacterial and fungal strains we employ. Further, the software provides a huge benefit in allowing us to custom-tailor Pathway/Genome Databases to our specific strain(s)."
Randy Berka, Director, Novozymes, Inc.
Querying, Visualization, and Analysis of Pathway and genome Databases
The Navigator component of Pathway Tools runs in both a Web mode that allows publishing of a PGDB on the Internet or an intranet, and as a desktop application. A partial list of features include:
- Visualizations of Biochemical Pathways, Chemical Compounds, etc.
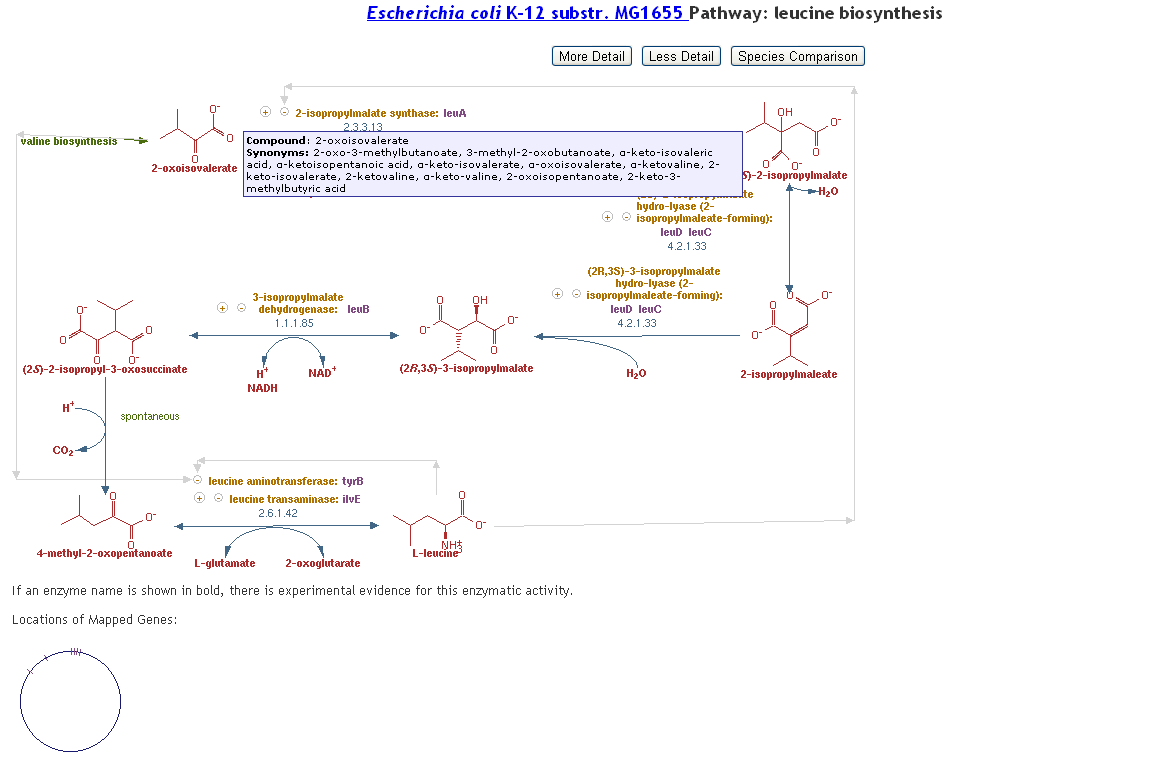
- Biochemical pathways (Figure 6) and reactions
- Chemical compounds
- Genes, proteins, and RNAs
- Operons and regulatory interactions
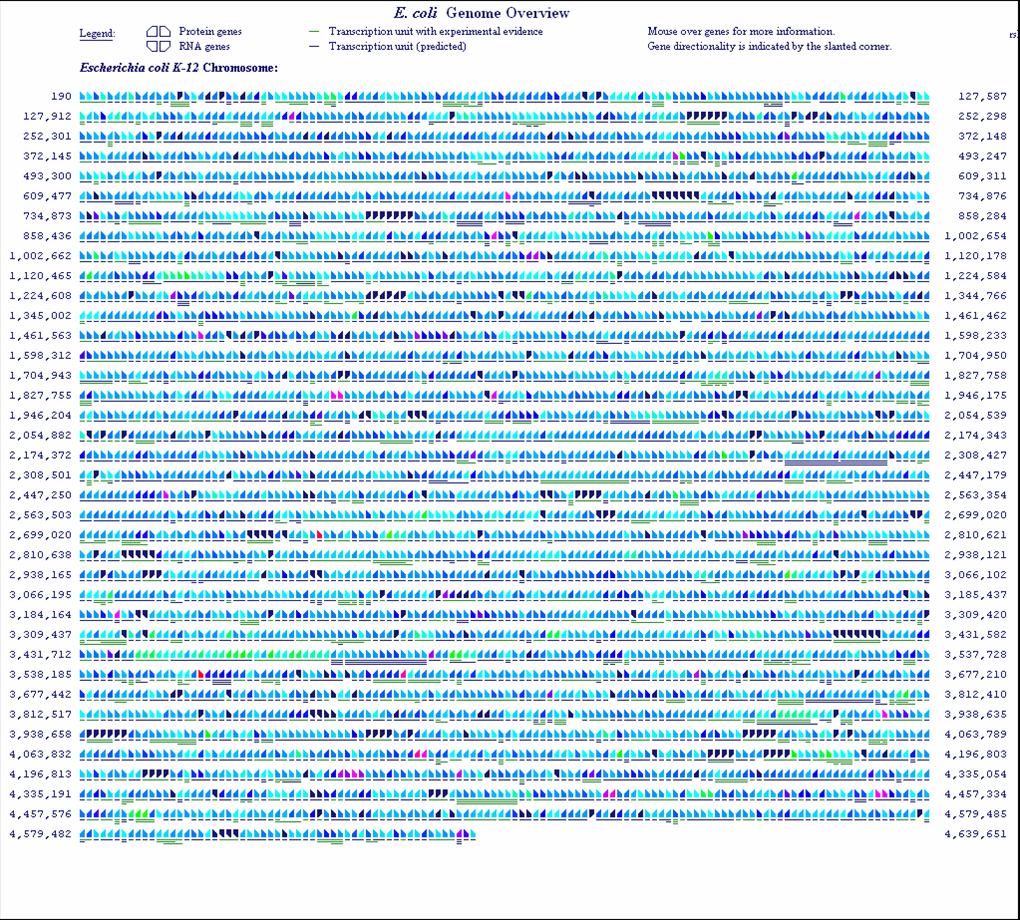
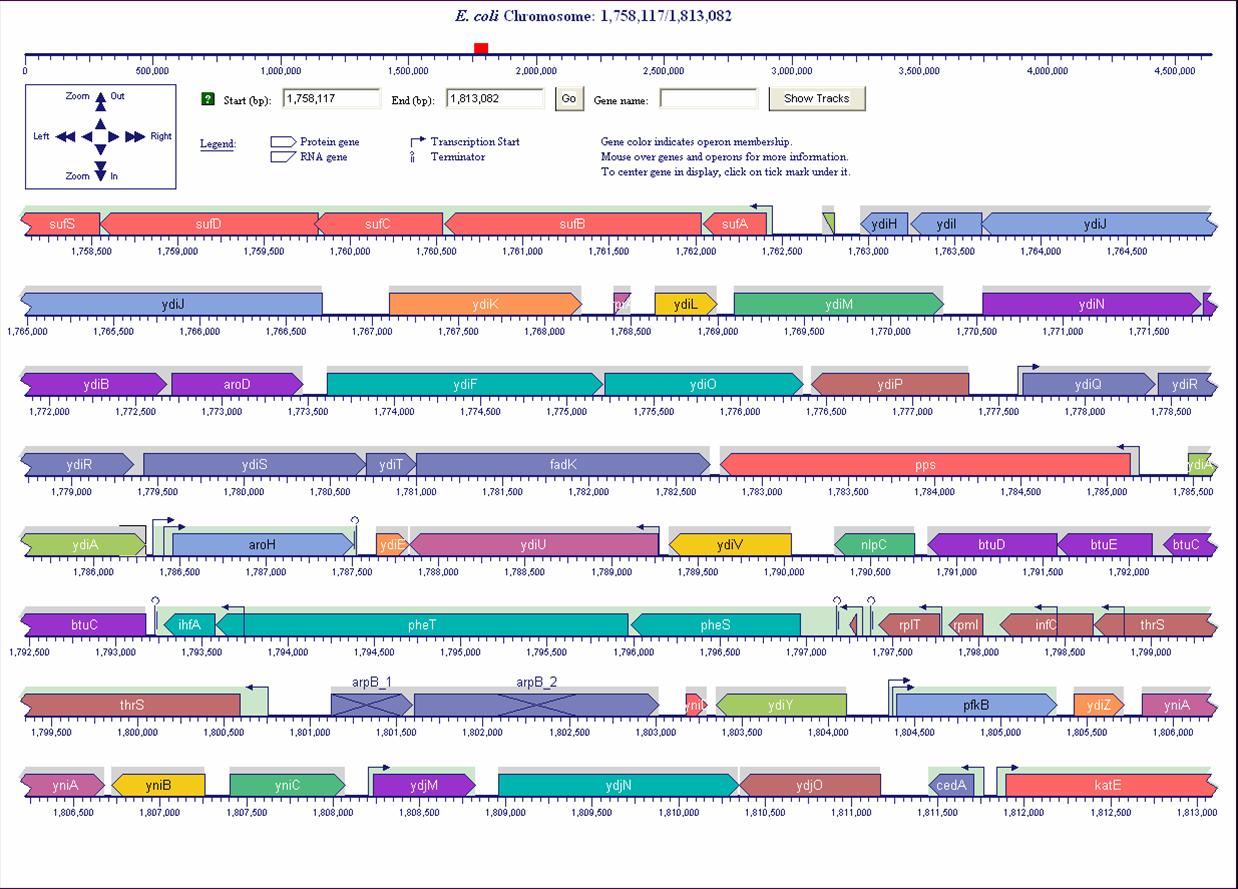
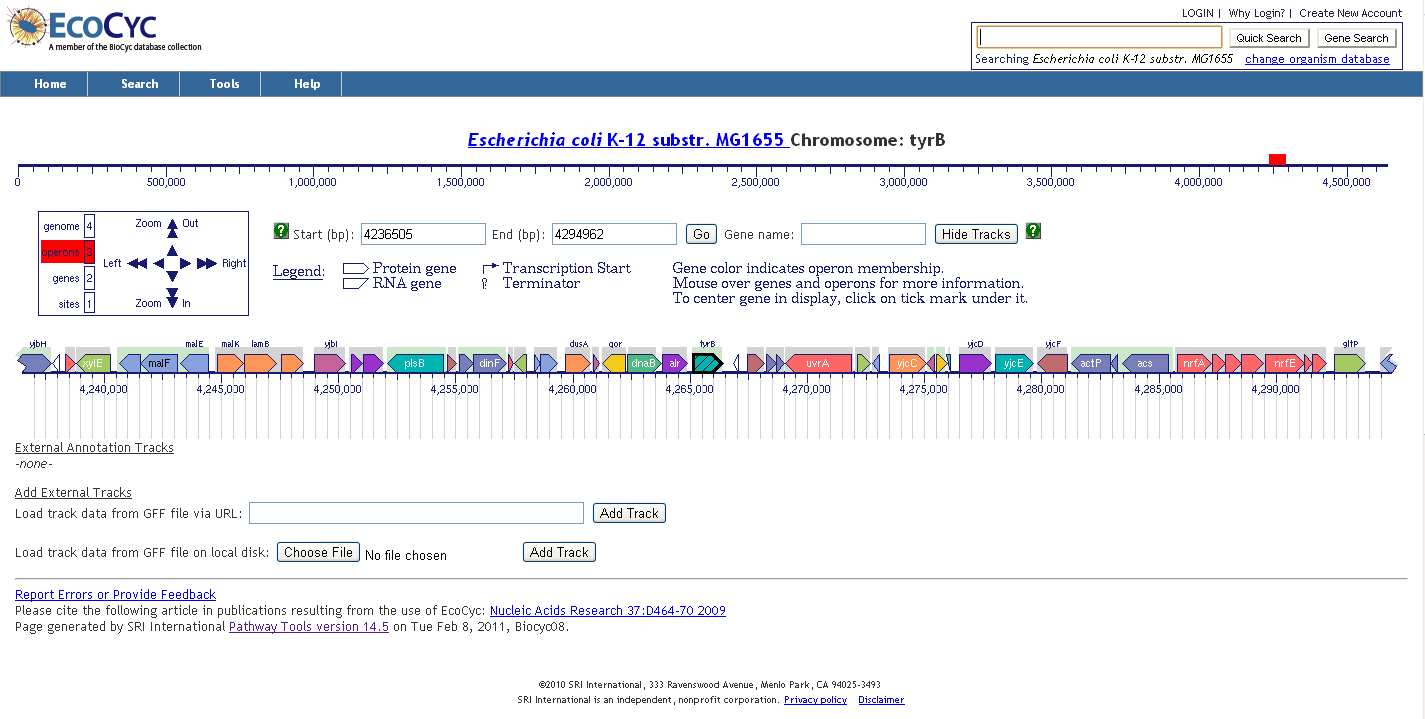
- Genome Browser (Figure 4) depicts genomic regions at user-selected resolution with semantic zooming that reveals new features at higher resolutions. Genome Omics Viewer (Figure 3) paints omics data onto a low-resolution depiction of an entire genome. Tracks facility (Figure 5) allows user datasets to be plotted against the genome.
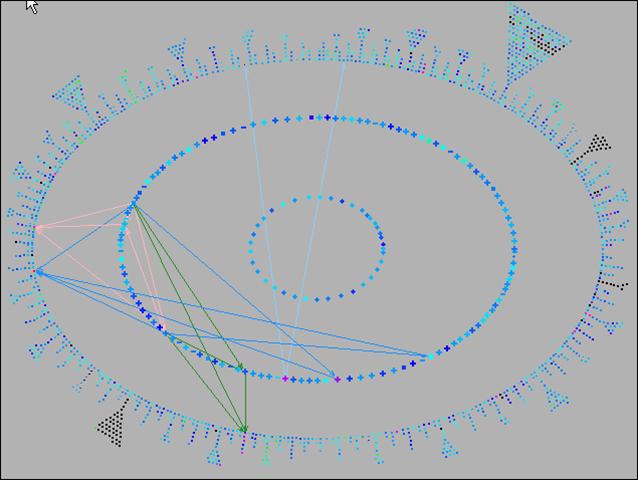
- Regulatory Overview (Figure 2) presents the genetic regulatory network stored in a PGDB. Regulatory Omics Viewer paints omics datasets onto the regulatory network to enable compari- sons of expression measurements with regulatory mechanisms.
- Cellular Overview diagram (Figure 1) is a full-screen depiction of the metabolic and transporter networks of an organism, and provides many tools for probing the cell’s biochemical network.
- Cellular Omics Viewer allows the user to paint omics datasets onto the Cellular Overview diagram. Scientists can interpret gene expression, proteomics, and metabolomics datasets in a pathway context, including animation of time-course or comparative datasets (example animation at http://biocyc.org/ov-expr.shtml)
- All omics viewers support animation of time course or comparative datasets, and graphing of individual omics data values.
- Over-representation analysis of gene sets and metabolite sets for gene ontology categories, regulons, and pathways.
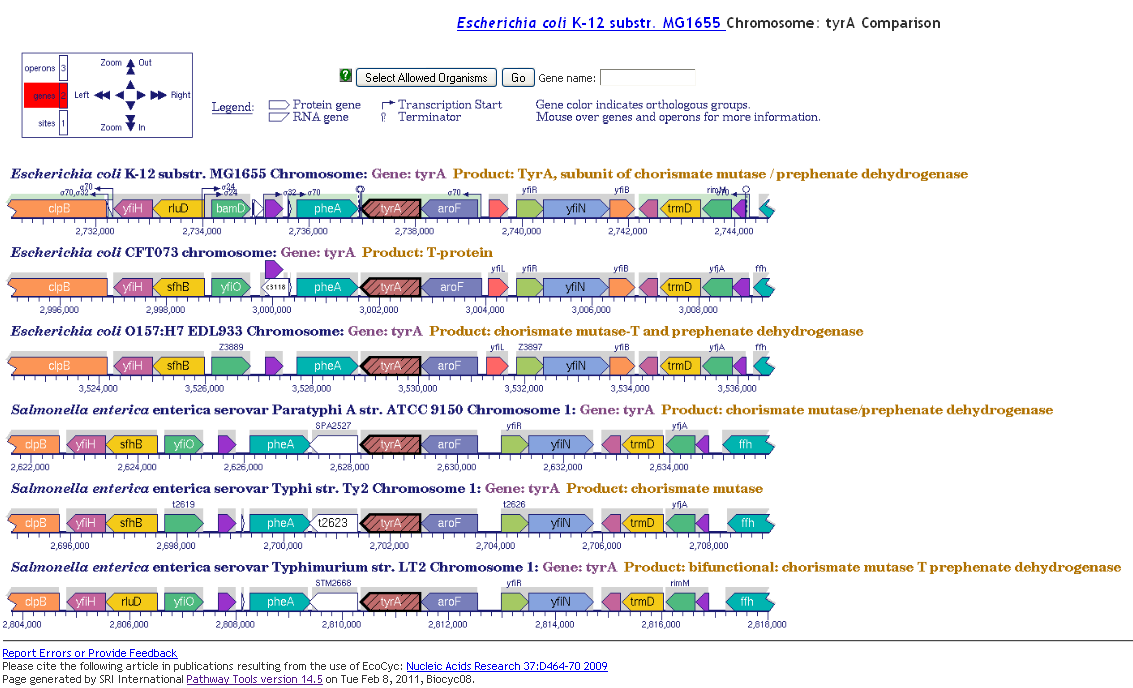
- Comparative genomics operations support a range of genome and metabolic comparisons, from visualization of chromosomal regions around orthologous genes to comparisons of whole metabolic networks. (Figure 7)
Pathway Tools Screenshots
| Figure 1, The Cellular Omics viewer | Figure 2, The Regulatory Overview |

|
|
|
Figure 3, The Genome Omics viewer |
Figure 4, The Genome Browser |
|
|
|
Figure 5, Genome Browser with Tracks |
Figure 6, Pathways |
|
|
| Figure 7, Comparisons |
|
For additional information, please see the Pathway Tools Information Site
| Copyright © Franz Inc., All Rights Reserved | Privacy Statement | 
|

|

|

|

|