| Allegro CL version 10.1 Unrevised from 10.0 to 10.1. 10.0 version | ||||||||||
The Inspector window displays information about objects. The same information is displayed (when not in the IDE) using the function inspect and the various inspector top-level commands documented in the inspector.htm.
This dialog is displayed by the various Inspect commands on the Tools menu, such as Tools | Inspect Selected Object. It is also displayed (even when the IDE is not running but is loaded) by the operators ide:ide-inspect and ide:ide-inspect-standalone.
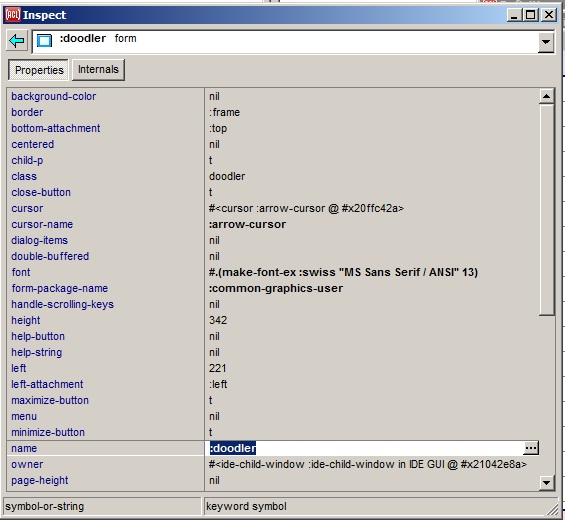
The illustration shows an Inspector window inspecting a form. We describe the various fields and controls on the Inspector, and the right button menu.
The buttons at the top (in the illustration, Properties and Internals, other objects may have more or different buttons), indicate what pane of the window is visible. In the illustration, the Properties pane is visible and the button looks pressed. Properties are usually changeable aspects of the object while Internals should not normally be modified. Controls have an Events button listing the event functions called when certain mouse events occur over the control.
The Inspector lists various component parts or other attributes of the object that is being inspected, with the name of the part appearing in the lefthand column and its value in the righthand column. The component parts of a standard object, for example, are its slots, whereas the parts of a list are the list's elements, with the indices of the elements serving as the part names. If the inspected object is a standard-object or structure-object, then the home package of each slot name symbol is also shown in the left column.
Each value is printed according to the IDE options dialog-print-level, dialog-print-length, dialog-print-array, and dialog-print-circle, which can be set on the
IDE 2 tab of the Options dialog. If the printed
representation doesn't fit in the single-line table cell that's
provided for it, you can see the full text (or much more of it) in a
large tooltip window by holding the mouse cursor over the value in the
righthand column. Even if the value does fit as printed, a tooltip
will still appear if a longer representation will be printed by
extending the printer variables *print-level*, *print-length*, and *print-array*. Specifically, the tooltip will
use a *print-level*
that's one greater than the IDE option dialog-print-level, a
*print-length* that's
triple the value of dialog-print-length, and
with *print-array*
always true. The necessary hovering time for the tooltip to appear is
controlled by the Common Graphics option tooltip-delay, which can be set on the CG tab of
the Options
dialog.
You can replace the value of most object parts by clicking on the value in the righthand column to select it, and then typing in a new value. This works only if the Lisp reader can return the desired type of value from the string that you type. Alternately, you can click on the small extended editor button at the right end of the selected row to show a dialog for editing the value in a more powerful way. On the Internals tab, the extended editor will always be a text-editing window where you can enter a Lisp form that will be evaluated to produce the value to use. On the Properties tab, a more specialized dialog may appear that's designed for editing the particular type of value that the property is declared to have, such as the font dialog when the property is declared to hold a font. The image on the extended editor button indicates which specialized dialog will appear.
Clicking on a part name in the lefthand column will inspect the value of that part. Then clicking the left arrow button at the upper left of the inspector will return to the first object.
The drop-down list at the top shows a history of the objects that have already been inspected by this inspector. The objects are arranged into a hierarchy, where objects that were inspected by clicking in the left column of the inspector are indented just below the objects from which they were inspected; otherwise more recently inspected objects appear toward the top of the list. Clicking an item in this list re-inspects it.
A pixmap appears at the left of each item in the drop-down history list to make it easier to find objects of various types. By default, widgets are identified with the pixmaps that are used for them in the Component Toolbar, windows display a picture of an empty window, all other first-class objects (instances of standard-object or structure-object) display a solid gray dot, and all remaining objects show a hollow dot. These pixmaps (except for the dots) also appear in the always-visible part of the history widget for the currently inspected object, and appear in the rows of the inspector body when it is inspecting a sequence.
The inspector may be customized to show additional pixmaps for other types of objects by defining pixmap methods.
The button with a left-pointing arrow at the upper left of the inspector re-inspects the previously-inspected object. Clicking this button multiple times will re-inspect successively older objects from the inspector history. Or use your mouse's back button if it has one.
The status bars at the bottom show the type of value accepted (on the left) and information on the value on the right.
Right-clicking in the inspector shows a pop-up menu of additional inspector commands. A child menu of this menu shows further inspector commands that are more easily accomplished in other ways but are shown as a reminder of their keyboard shortcuts. Here are the inspector-specific commands on the main pop-up menu:
:calls as the relation
argument. Callers are known only when *record-xref-info* and *load-xref-info* are true when the code is
compiled and loaded respectively; those variables are always true by
default in the IDE.
:uses as the relation
argument. Users are known only when *record-xref-info* and *load-xref-info* are true when the code
is compiled and loaded respectively; those variables are always true
by default in the IDE.
(gc t)
and/or use the Clear History command on this same menu and the
Clear History button in the Debug Window's toolbar and
the Clear button on the Trace Dialog.
When you inspect a long list or vector, the inspector will initially display only the first fifty elements, for efficiency reasons. To display the next set of fifty elements, you simply need to scroll to the bottom of the ones that are displayed so far. You can do that either with the keyboard (using the PageDown key or the down arrow key) or with the mouse (by dragging the scrollbar or pressing its lower arrow button). GTK note: You may need to use the keyboard technique if the scrollbar method does not work.
The Properties and Events tabs also provide brief documentation on how to access an object programmatically (assuming that properties are defined for the object). The function for reading the value of a property almost always has the same name as the property.
Thus if you notice in the inspector that an object has a property called border, this means that you can read the current value of that property with a form such as
(border my-object)
Likewise, the writer function is almost always the setf of the property name, and the initarg for specifying the property value when creating the object is almost always the corresponding keyword. So
(setf (border my-object) :frame)
would set the border property, and an initarg/value pair such as
:border :frame
would initialize the border when creating the object.
A property value is displayed in a bold font if it is not equivalent to the programmatic default value for that property. This highlights values that you have changed, as well as some sample values that are given to widgets that you place onto forms (and which you typically will want to change). A read-only value will never be bold. A handful of properties are never shown bold because they generally do not have meaningful default values and are more distracting than useful when made bold; these exceptions include the properties child-p, class, tab-position, left, top, width, height, dialog-items, and pixmap-use-handle.
Brief help information is supplied in the main Allegro status bar when a property is selected in the inspector, and for more detailed help (or to make sure that the accessor functions really have the same name) you can invoke the Help | Help On Selected Symbol command (shortcut F1) while the property or event handler of interest is selected in the inspector.
For further information on using properties programmatically, refer to defproperties or define-property.
Copyright (c) 1998-2022, Franz Inc. Lafayette, CA., USA. All rights reserved.
This page was not revised from the 10.0 page.
Created 2019.8.20.
| Allegro CL version 10.1 Unrevised from 10.0 to 10.1. 10.0 version | ||||||||||