| Allegro CL version 10.1 Moderately revised from 10.0. 10.0 version | ||||||||||
The Trace Dialog provides a graphical display of all calls to traced functions and methods that occur while the dialog is present. This includes functions that are traced by calling trace or using the :trace top-level command as well as functions that are traced by selecting the function name in any IDE dialog and invoking the Run | Trace command.
If the Trace Dialog is present, then all trace output in Common Graphics and IDE processes will go to the Trace Dialog and will not be printed elsewhere. Otherwise all trace output is printed as usual in the listener for each process. The Trace Dialog is "present" if it has been shown with the Run | Trace dialog command and it has not subsequently been hidden by clicking its close button or using the File | Close Window command. (It is still present if it has been iconized or is covered by other windows.)
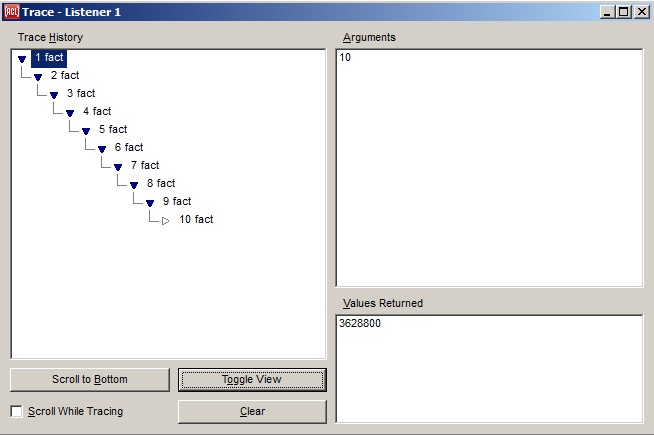
The large Trace History outline at the left shows the hierarchical relationship of the function calls, where a child item represents a call that was made while inside the call represented by its parent item. The call is identified by an index number and the function name. Next to the name is the amount of time spent in the call.
Selecting a call in the Trace History outline displays more detailed information about that call in the dialog's other widgets.
The outline (which is an instance of an outline widget) can be navigated quickly by
pressing the J, K, F, and D keys as alternatives to the down, up,
right, and left arrow keys respectively, and the T and B keys for the
Home and End keys. This works because the outline widgets in IDE tool
dialogs enable their handle-home-key-shortcuts property.
The Arguments and Values Returned widgets at the right
show the arguments that were passed to, and the values returned from,
the selected function call. (If the values were thrown rather than
returned, then the widget label will say "Values Thrown to <some
tag>" instead.) Note that each value is the actual lisp object
that was passed, and so you can select a value and then use commands
such as Tools | Inspect Selected Object
to inspect that argument object or Tools | Return Selected
Object to set the value of the variable * to that object.
Double-clicking an argument or
returned value will inspect it.
Pressing the Toggle View button shows an alternate view that replaces the Arguments and Values widgets with two others. (Pressing this button repeatedly toggles between the two views.) The Effective Method widget shows the individual methods that may have been called for a selected generic function call (given the particular arguments that were passed), along with their calling order and relationship. Each method is represented here only by its qualifiers and specializers to save space, since the generic function name is highlighted in the Trace History to the left. Double-clicking an individual method (or using Search | Quick Find Definition) will invoke the editor on that method's souce code directly if its location is known. Using the Run | Trace command on a method in this widget will trace the individual method rather than its generic function. This widget will show information only for a traced generic function, and not for a traced regular function or a traced individual method.
The Stack widget (also in the alternate view shown by the Toggle View button) lists the names of functions that were found on the function call stack at the time of the selected call. The most recent calling function is at the top of the list. The Depth widget lets you specify how many stack frames to search for calling functions; a lower value may decrease the amount of time taken up by tracing. The Stack widget can be useful when you can't remember the name of a function that you would like to trace --- you can instead trace a lower-level function that you know that the desired function calls, and then look in the stack widget at the callers to that function; if you see the desired function in the stack widget, you can select it and use Run | Trace to trace it, and then run your test again with the desired function traced.
The Clear button will clear all accumulated information from the trace dialog, making it easier to find subsequent trace information at the top of the Trace History.
Checking the Scroll While Tracing check-box will turn on the scroll-while-tracing configuration option. This option continuously scrolls traced function calls into view as they occur, allowing you to see when each call happens. On the other hand, this can slow things down or cause the Trace History to scroll to the bottom when you are looking at an earlier call. The Scroll to Bottom button may be used instead to quickly scroll to the most recent trace information only when desired.
You can resize some of the widgets in the Trace dialog by using
the invisible split-bar
widgets that lie between them. Just move the mouse cursor into the
vertical gap between the two columns of widgets, or into the
horizontal gap between the widgets in the righthand column, until the
mouse cursor becomes a resizing cursor. Then click and drag.
Traced calls that occur in multiple threads are combined into the single outline widget of the Trace Dialog, but hierarchies of traced calls in multiple threads are never interleaved in the outline. Specifically, the tree of calls that appear under a single top-level item in the trace outline are always calls that occurred in the same thread as that top-level item; any traced calls that occurred in other threads during the call represented by that top-level item will appear under further distinct top-level items of the trace outline. The numbers at the left of each outline item, on the other hand, indicate the global order in which the individual calls occurred; so the numbers will not be in numerical order from top to bottom if hierarchies of traced calls in multiple threads overlap in time. The title of the Trace Dialog indicates the thread in which the currently selected call occurred. (Tracing in the event handling code for a specific window can be suppressed. See inhibit-trace-for-object.)
Double-clicking an item in the Trace History outline will invoke the Search | Quick Find Definition command on the selected function call. This overrides the usual outline functionality of toggling the selected item open or closed, but that can still be done by single-clicking the item's arrow icon or by using the left and right arrow keys. Several other commands from the IDE menu-bar of likely interest are on the right-button pop-up menu. Pressing the Enter key when any of the non-button widgets on the Trace dialog has the keyboard focus does the same thing as double-clicking the selected value there.
When either Search | Find Definition or Search | Quick Find Definition is invoked on a call to a generic function in the Trace History outline, the methods that are presented as choices will include only the methods that are applicable to the arguments that were passed in that function call, sorted with the most applicable methods first (as determined by compute-applicable-methods). To instead choose from all methods of the generic function, invoke Search | Find Definition and then turn on the "All" check-box on the Definitions Dialog.
See trace-format for a way to write arbitrary debugging output to the Trace Dialog. See process-trace-color and with-trace-color for information on modifying the background color on a per-process basis. The configuration option scroll-while-tracing allows you to view new trace output as it is being collected. To direct trace output from non-CG/IDE processes to the Trace dialog, call use-trace-dialog-in-this-process.
The File | Save command is implemented for the trace dialog to save all the trace info (except the stack and effective method for each call) as an indented text file.
Copyright (c) 1998-2022, Franz Inc. Lafayette, CA., USA. All rights reserved.
This page has had moderate revisions compared to the 10.0 page.
Created 2019.8.20.
| Allegro CL version 10.1 Moderately revised from 10.0. 10.0 version | ||||||||||