| Allegro CL version 10.1 Moderately revised from 10.0. 10.0 version | ||||||||||
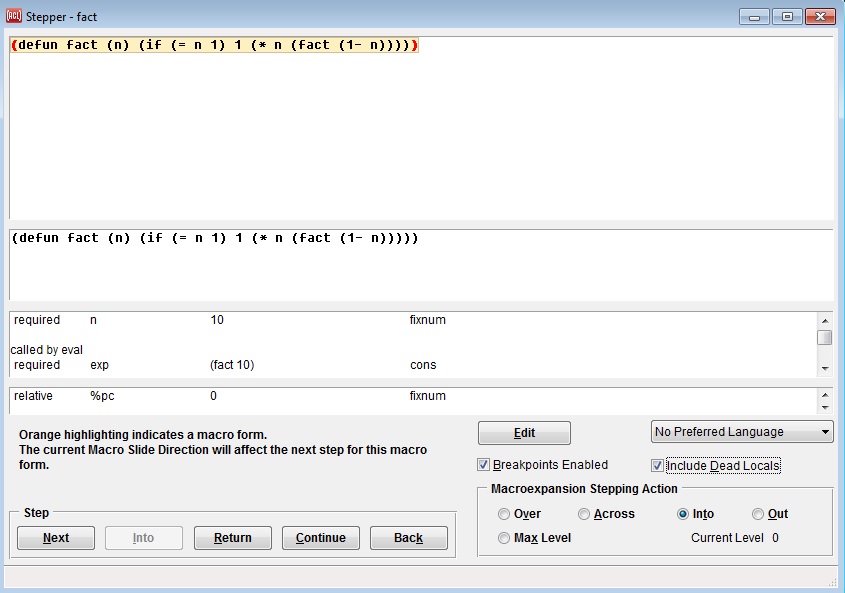
The Stepper Dialog allows carefully testing compiled code by interrupting execution at selected forms in the original source code and at macroexpansions of the code, allowing state to be examined at each stop point. The illustration shows the Stepper Dialog stepping through the fact function, which calculates a the factorial of its argument. The definition of fact is shown as described below.
The dialog displays the original lisp source code for a function or method that is being stepped through, highlighting the form at which the stepper is stopped. Button widgets allow proceding in various ways each time execution has been interrupted. The dialog also displays macroexpanded forms and the values of arguments and local variables, updated after each step. The IDE's code editor can be invoked at any time on the code being stepped through.
The dialog is implemented on top of the base lisp's stepping facility, which also has a simpler textual interface that can be used in a lisp listener. See The Lisp DeBug (ldb) stepper and The source stepper, both in debugging.htm.
In the IDE, stepping will be done in the Stepper Dialog if it is present when a breakpoint is hit, and otherwise textual stepping will be done in the listener. The Stepper Dialog is present if it has been shown by using the Run | Stepper Dialog command and has not been closed or iconized more recently, and so it is still present if it is simply buried by other windows. (It's recommended that you do not show or close the Stepper Dialog while stopped at a step, or these two modes may become confused.)
In order to successfully step through source code, it's important to do some setup in the right order. Here are the general steps, as it were, for setting up source-level stepping:
One caveat: Compile and Load does not recompile the code if there is an up-to-date fasl file. To ensure recompilation, you could use Compile followed by Load. Or first save a buffer in the editor to ensure that the fasl is no longer newer, and then use Compile and Load. Status bar messages will indicate when compilation was really done.
Advanced explanation: The actual requirement is for particular
compiler switches to be enabled when the tested code is compiled.
This is done automatically when using IDE commands while the Stepper
Dialog is present, but you could alternately manage the compiler
switch variables yourself. All of the needed switches will be true if
the general debug optimization level is 3, as with (declaim
(optimize (debug 3))). The individual switch variables
include save-source-level-debug-info-switch for
source-level stepping, along with save-arglist-switch, save-local-names-switch, and
save-local-scopes-switch
in order to display local variable names and whether each variable is
currently "dead" and so on.
If the selected function name is a generic function, then a pop-up menu will appear where you can select the particular method to breakpoint. The special All choice at the top of the menu will breakpoint all methods. Another way to breakpoint a particular method is to use the Definitions dialog on a generic function, then select one of its methods in the dialog's list and invoke Run | Set Breakpoint.
After the setup above, if you see the Stepper Dialog with a lisp form in the second pane from the top, then you have successfully initiated source-level stepping, and can proceed stepping through the definition that's shown. If you instead see an assembly language form in the second pane, then review the instructions above for setting up source-level stepping.
The three content panes are unlabeled to save space, due to the typically large amount of content. Here are brief descriptions for now: The uppermost pane of the dialog (the Definition Pane) shows the entire definition that is being stepped through. The second pane from the top (the Form Pane) shows the form at which the stepper is currently stopped. The third pane (the Stack Pane) shows the arguments and local variables of the function that is being stepped through.
Here is the general procedure for stepping through code:
Step Into is most suitable when the highlighted form in the Definition Pane has a green background, which means that the necessary debugging information is available for source-level stepping through the function that will be called.
Clarification: The bullets above for the four stepping buttons describe how the stepper will stop at "temporary breakpoints" that the stepper sets itself. In addition, the stepper will always stop at "user breakpoints" that you have set yourself (until you disable or delete the breakpoints). So you may need to use the Continue button a number of times to stop at all user breakpoints before stepping finally completes. Or to exit all stepping as quickly as possible, use Run | Remove All Breakpoints and then press the Continue button a single time.
It can be useful to add a breakpoint somewhere past the highlighted form in the Definition Pane, and then to press the Continue button to proceed to that point. That's faster than stopping at all of the forms in between.
You can set breakpoints inside a definition without first breakpointing the entrance to the function by using Run | Show Definition in Stepper Dialog. That command will display a definition in the Stepper Dialog even though it is not being executed and stepped through (assuming that the function has been compiled for source-level debugging -- see The source stepper in debugging.htm). You can then set breakpoints inside the definition before running code that will call the function and stop at those breakpoints.
The Definition Pane (at the top of the dialog) shows the source code for the function or method that's currently being stepped through. This is a copy of the real source code text, complete with comments and original line breaks. The form at which the stepper is currently stopped will be highlighted with a different background color. The meaning of the various colors is covered in a separate section below. Red parentheses are drawn around any breakpointed forms.
When the mouse moves over a local variable in the definition pane, the current value of the variable will now be shown in the message widget. This avoids often needing to scroll down to that variable in the list of all arguments and local variables.
The breakpointable form under the mouse (if any) in the Definition Pane will have a blue border drawn around it; this is the "selected object" in the pane to which commands on the right-button shortcut menu will be applied. Even keyboard shortcuts from the IDE's menu bar can be applied to the highlighted form. If the mouse is not inside the Definition Pane, then the form at which the stepper is stopped is the selected object to which IDE commands will be applied.
The Form Pane (second from the top) shows just the form at which the stepper is currently stopped. This form would be executed by a subsequent Step Next. Sometimes this is a form in the original source code, and is the same as the highlighted form in the Definition Pane, and at other times it is all or part of a macroexpansion. This form is shown pretty-printed by the lisp printer, and therefore is typically more compact than the highlighted form in the Definition Pane even when they are the same form. You could click on a symbol in this pane and then apply IDE menu bar commands to it, for example, as in the editor.
The Stack Pane (third from the top) lists the arguments and local variables of the function that is being stepped through, followed by the arguments to the function that called the function being stepped, and then by the arguments to the next calling function. When a new function is first stepped into, the arguments are listed first, whereas on subsequent steps the local variables are listed first; this is done so that the most pertinent information at each step is more likely to be visible when the Stack Pane remains scrolled to the top.
Whenever the value of a local variable changes during stepping, the new value will appear in this list immediately. A new variable value (and the variable name) will be shown in red text, with the previous value displayed beside it in parentheses, and the variable will be scrolled into view automatically. (When multiple variables have changed, only the first one may be scrolled into view.)
A new variable value will not be updated in this list if it is being held in a register for efficiency, rather than being stored in the variable's official location on the stack. You may see it updated here later if the new value is eventually moved to the stack, perhaps when the value is actually used.
You can click on a line of text in the Stack Pane (third from the top) to select the value of an argument or local variable. Then (as usual in the IDE) you can invoke any command on the IDE's menu bar on the selected argument or variable value; this will do something if that command makes sense on that kind of value. Or right-click a value to see a pop-up menu of suggested commands for that kind of value. Or double-click a value to inspect it in the IDE's Inspector.
As a debugging experiment, you can modify the value of an argument or local variable at any step, and then continue stepping with the replacement value. To do this, right-click the desired argument or variable and select Modify Argument or Variable from the pop-up menu. A modal dialog will then appear, where you can enter a lisp expression that will be evaluated to produce a replacement value for that argument or variable. You can then continue execution with the replacement value.
When the Include Dead Locals check box is checked, as it is by default, then the Stack Pane displays all local variables. When it is unchecked, variables that are "dead" at the current step are excluded from the list. A dead variable is one whose current value will no longer be used as the execution of the current function proceeds (though it may later be set to another value that will be used).
The form in the Definition Pane at which the stepper is currently stopped is drawn with a background color that can have different meanings. An explanatory note will appear in the dialog the first three times each highlighting color is used.
When the highlighting is blue, this is simply the default highlighting color that is used when none of the special colors below are in effect.
When the highlighting is green, it means that source-level debugging information is available for the function that the highlighted form will call. This is a "green light" that pressing the Step Into button will continue doing source-level stepping. The called function would then replace the calling function in the Definition Pane.
When the highlighting is yellow, it means that you can do a Step Into to step through the function that is being called on that step, though no source debug info is known for the function that is being entered and so it will be stepped through at the assembly language level. So this is a yellow light to do a Step Into with caution. When that function call returns, the stepper should resume stepping that current function at the source code level.
When the highlighting is orange, it means that you are stopped at a macro form. The next step may be affected by the current choice in the Macroexpansion Stepping Action group at the lower right of the stepper dialog. See the notes that are shown in the dialog's status bar as you move the mouse over those choices.
When the highlighting is gray, it means that no source code range is known for the current step point. The previously-highlighted form remains highlighted simply as a general landmark. Typically the higlighted code will be a macro form that you are still somewhere inside, but execution may actually be at some point beyond the gray highlighted form.
When the highlighting is purple, the highlighted form is a preview of a function call that will be made later, after its arguments are evaluated. To step into that function, you would first need to do more Next steps to evaluate the arguments. When the highlighting returns to this same form just before the call is really about to be made, it will be green or yellow to show that you can step into the function at that time.
Whenever the Definition Pane at the top has the keyboard focus, each of the three panes that display information may be scrolled with the keyboard using the usual vertical scrolling keys (PageUp and PageDown, Home and End, and the up and down arrow keys). If no shift keys are held down, then the Definition Pane is scrolled. If the shift key is held down, the Form Pane is scrolled, and if the control key is held down, the Stack Pane is scrolled.
Whenever execution stops at a step and the Stepper Dialog is selected, the keyboard focus is moved to the Definition Pane to facilitate scrolling the three content panes in this way.
When either the Definition Pane or the Stack Pane has the keyboard focus, Search | Find Forward (from the IDE's menu bar) can be used to search the pane for an arbitrary string, and then Search | Find Again may be used to find subsequent matches.
In the Definition Pane, Search | Find Forward will always start at the top of the definition. A string match will be highlighted with a light red background.
In the Stack Pane, Search | Find Forward will always start at the top of the list. Only variable names are searched for string matches. A line with a matching variable name will be selected.
Pressing the Tab key in either of these panes will move the keyboard focus to the other pane. A vertical gray bar is drawn just inside either of these pane's scrollbar when it has the focus.
If breakpoints are added to functions for which source-level debugging information is not available, and the Stepper Dialog is present when the breakpoints are hit, the Stepper dialog will still display some information and allow stepping to be done. The Definition Pane will still display the function source if the usual "source file information" is available, but will not highlight forms for the current step because they are not known. The Form Pane will display an assembly language form rather than a lisp form. And the Stack Pane will still display local variable values.
The Preferred Language Combo Box can be used to specify the language in which you would like to do stepping. The default setting is No Preferred Language, which will map to the highest-level language that pertains to the code being stepped. If you select Asm, then stepping will be performed at the assembly language level even where lisp source-level information is available. (Stepping through other languages such as Python may be possible in the future.)
When changing this setting, existing breakpoints will still be stepped in the language that was current when those breakpoints were added. You would need to delete and re-add those breakpoints to use them with the newly-selected language.
The Macroexpansion Stepping Actions radio buttons at the lower right specify what action to take when encountering a macro form. The choices are
Running the mouse cursor ove rthe choices displays documentation in the dialog status bar at the bottom of the dialog. The top-level command :help step typed to a Listener prompt will also provide documentation.
The dialog has two split-bar widgets for adjusting the relative
size of the three content panes. When the resizing mouse cursor
appears as you move the mouse between the panes, click and drag to
adjust the sizes.
Copyright (c) 1998-2022, Franz Inc. Lafayette, CA., USA. All rights reserved.
This page has had moderate revisions compared to the 10.0 page.
Created 2019.8.20.
| Allegro CL version 10.1 Moderately revised from 10.0. 10.0 version | ||||||||||