| Allegro CL version 10.1 Unrevised from 10.0 to 10.1. 10.0 version | ||||||||||
This dialog displays runtime analysis statistics. A runtime analysis is a collection of data about which functions were being called and where most of the time was being spent or where the most memory was being used by the creation of new lisp objects. (See runtime-analyzer.htm.)
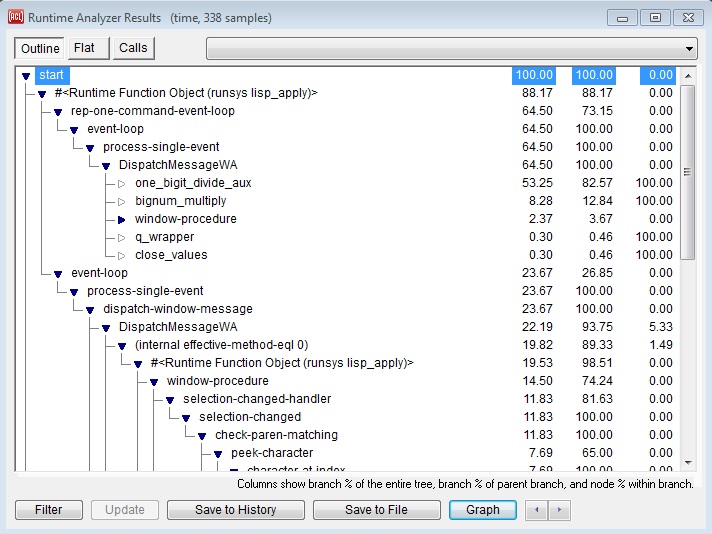
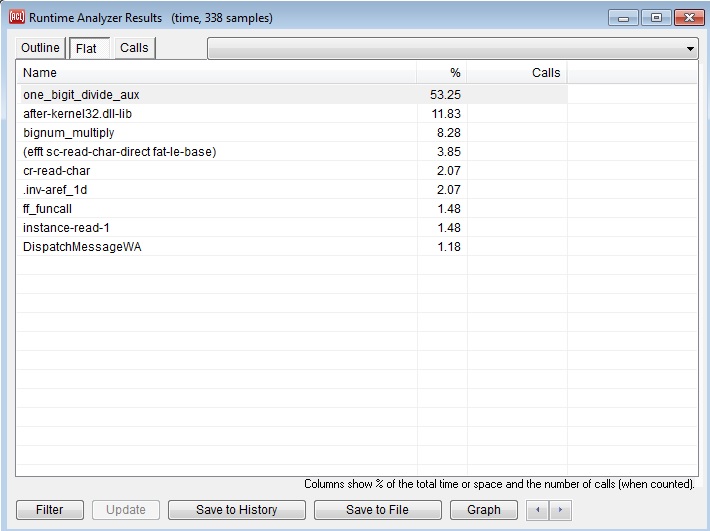
The Runtime Analysis Results dialog has several displays: the Outline display (the top picture above), the Flat display (the second picture above), and the Calls display (not illustrated). There is also a Graph display, which appears in a separate dialog when the Graph button at the bottom is clicked. A Graph example is shown below.
To start collecting data, either invoke the Run | Runtime Analyzer Control | Start/Resume Sampling command or display the Runtime Analyzer Control dialog (by invoking the Run | Runtime Analyzer Control Dialog command) and press its Start Sampling button. When you feel enough data has been collected, stop data collection either with Run | Runtime Analyzer Control | Stop Sampling command or the Stop button on the Runtime Analyzer Control dialog. Now you are ready to analyze the data using this dialog. (Alternately, you can call start-profiler, stop-profiler, and related commands programmatically, and then display the results on this dialog.)
When the dialog is first displayed by the Run | Runtime Analyzer Results Dialog command, no information is displayed, and so you need to press the Update button to analyze the current analysis data and display it here. Similarly, if a subsequent analysis is performed, invoking this dialog with the Run | Runtime Analyzer Results Dialog command will continue to show the currently-analyzed data until you again press the Update button to analyze the newer data. (On the other hand, pressing the Show Results button on the Runtime Analyzer Control dialog will automatically update this dialog to show the new data.)
The three tabs summarize the collected data in up to three ways. Illustrated above is the Outline presentation (onthe Outline tab), which corresponds to the output from show-call-graph, and the Flat presentation (on the Flat tab), which corresponds to the output from show-flat-profile.
The third tab is the Call Counts presentation, which corresponds to the output from show-call-counts (not illustrated).
(Data was collected from defining and running the factorial function, excluding most IDE-related calls. One usually collects data when running your application or parts of your application. See runtime-analyzer.htm for discussion of how to use the runtime analyzer. Here we are only interested in the dialogs and how they display.)
Nodes in the outline presentation indicate functions or methods called, as do the entries in the left column of the Flat and Call Counts displays. The Flat and Call Counts presentations may be sorted differently by clicking on the column headers. And (as usual in the IDE dialogs), the Search | Find Forward or Search | Find Backward command may be used to search for arbitrary strings in any of the presentations.
The outline (which is an instance of an outline widget) can be navigated quickly by
pressing the J, K, F, and D keys as alternatives to the down, up,
right, and left arrow keys respectively, and the T and B keys for the
Home and End keys. This works because the outline widgets in IDE tool
dialogs enable their handle-home-key-shortcuts property.
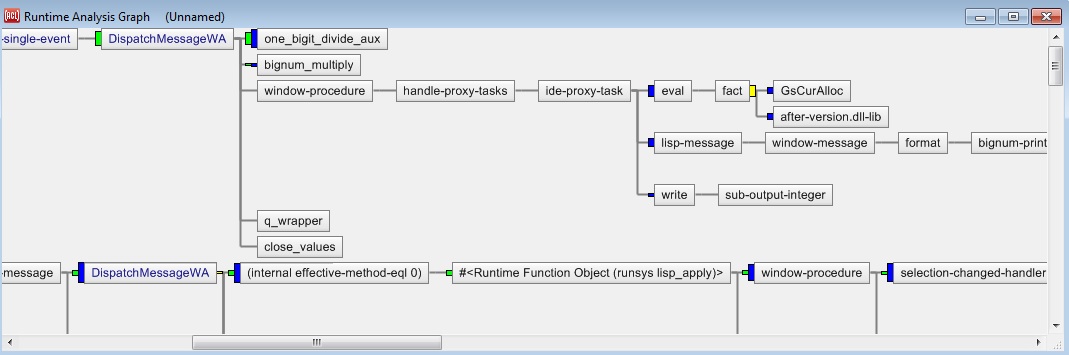
Clicking the Graph button presents the information from the Outline presentation as a tree graph. The blue bars on the left side of the graph nodes indicate the portion of the time spent (or space consed) in the node's branch as a fraction of the time spent in the parent node's branch. If the blue bar is as tall as the node itself, that indicates that 100% of the time in the parent branch was spent in this branch; a blue bar half as tall as the node indicates that 50% of the parent branch was spent in this branch. If there is a green bar, that indicates the portion of the entire analysis time that was spent in this node's branch. The yellow bar on the right side of a node indicates the portion of that node's branch that was spent within that node itself, as opposed to its sub-nodes; in other words, the portion of hits that occurred within that function itself rather than in the functions that it called. The yellow bars are not drawn on the leaf nodes since they would always be the full node height on those nodes.
The appearance of nodes on the Windows platform can be controlled with the configuration options ide:use-color-gradients-in-tree-graphs and ide:use-antialiased-text-in-tree-graphs.
Similarly, the blue bars are not drawn on "only child" nodes, since they would also always be the full node height.
Press this button to display a dialog showing various types of nodes to exclude from the outline or graph. This can be useful to prune a huge number of nodes down to a more manageable set. Press the Update button after modifying the filter to update the display to reflect the new filter.
Press this button to allow re-viewing this analysis after further analyses have been performed (within this IDE session). You will be asked to enter a name for the analysis, which will be added to the combo-box list at the top of the dialog. Selecting the name from this combo-box at some later time will once again display that analysis in the dialog.
Press this button to save the contents of the currently displayed analysis to a plain text file. (The File | Save command does this as well when this dialog is selected.) It sometimes may be useful to send this generated file to Franz with a bug report.
The file will contain only the lines are currently visible in the
outline widget, so you may want to open the outline further to reveal
any lines that look interesting before saving to file. (As usual with
a Common Graphics outline control, you can control-click on the
open/close icon of an outline-item to open all of its descendents, or
type control-rightarrow.)
The right-button menu in the Outline view or in a graph contains special analysis commands, rather than the usual selection of commands from the menu-bar as in most IDE dialogs.
When a number appears after a method or function name, either in the outline view or a analysis graph, it is the number of times that that method or function was called. These numbers will be shown only when call counts were included in the analysis, and only for the particular methods or functions that were counted). If the method or function appears in more than one branch of the analysis, the number is for the whole analysis rather than for that particular branch.
When the text in a node of an analysis graph is dark blue rather than black, it indicates that there are additional nodes in the graph for that method or function, where it was called in other places. The commands "Print Statistics" and "Graph Combined Subtree" on the right-button menu may be particularly useful on these nodes, because they provide combined information on all of the branches that begin with that method or function.
Copyright (c) 1998-2022, Franz Inc. Lafayette, CA., USA. All rights reserved.
This page was not revised from the 10.0 page.
Created 2019.8.20.
| Allegro CL version 10.1 Unrevised from 10.0 to 10.1. 10.0 version | ||||||||||