| Allegro CL version 10.1 Unrevised from 10.0 to 10.1. 10.0 version | ||||||||
This document contains the following sections:
1.0 IntroductionAllegro Composer is no longer supported. The version of the software it depends on (CLX), which works with Allegro Composer is also out of date. Users on Windows, Linux, and MacIntosh machines are urged to use the IDE (see cgide.htm) instead.
Allegro Composer is an interactive, window-based development environment to be used with Allegro CL on Unix platforms. It contains a debugger, an inspector, a runtime analyzer, various browsers (for processes, CLOS objects, etc.), a connection to the Cross Reference facility, and more. You must run Allegro CL as a subprocess of Emacs. The Composer windows are X windows.
Subsections of this section describe how to set up your system for Allegro Composer, how to start Allegro Composer, and how to customize Allegro Composer.
You need to have the X window system running on the machine where you intend to display Composer Windows. This machine is typically (but not necessarily) the same machine that displays the Emacs window (it need not be the machine where Emacs is running, of course).
It is possible for a window manager to interfere with the mouse events associated with Composer windows. However, the mouse actions associated with gestures can be configured at run time (as described in Section 3.3.1 Changing gesture bindings) and the Emacs menus use mouse buttons without associated keys. Assuming that the left and right mouse buttons are not used alone by your window manager, you should not have a problem with the interface between Allegro Composer and your window manager. In general, that means that your window manager should not be configured to use button1 (what we call the left mouse button) or button3 (what we call the right mouse button) without also using keyboard keys.
See Appendix A Configuring X windows for Allegro Composer for more information on setting up your system. We have the information in an appendix because users generally do not have difficulty once things are set up correctly.
There are no Allegro CL images that contain Allegro Composer. If you want to build such an image, start Allegro CL and (as the first action) load the file buildcomposer.cl. This will create an image named composer.dxl or composer8.dxl (as you are running a 16-bit character or an 8-bit character image). It also copies the executable (mlisp or mlisp8 to composer or composer8). You can then use that image, and Allegro Composer will be loaded.
If Allegro Composer is not included in the running image (see Section 2.2 Building an image that contains Allegro Composer, you must load composer.fasl (which in turn may load additional files). Do this by evaluating:
(require :composer)
You may invoke Allegro Composer whenever you are running Allegro CL as a subprocess of Emacs (using the emacs-lisp interface) and X is available to you. For information on starting Allegro CL as a subprocess of Emacs, see Running Lisp as a subprocess of Emacs in startup.htm; see also eli.htm. (Note that Emacs, Lisp, and X may all be running on different machines communicating over the network. Of course, X must be displaying on the machine where you are sitting.)
The functions used to start and stop Allegro Composer, along with other
composer-related functions and variables, are in the
composer package. The nickname of this package is
wt.
You may wish to use this package (so that you do not have to
package-qualify exported symbols). Do so by evaluating
(use-package :composer).
You can start Allegro Composer by choosing the Start Composer menu item on the Emacs ACL/Composer menu.
You can also start Allegro Composer with the function start-composer. Arguments to this function allow you to specify the X host, display, and screen, and allow you to load an init file. If the host, display, and screen default to the value of the DISPLAY environment variable, it is often not necessary to specify them. (See the description page for a complete description.)
If the read-init-file is true, the system tries
to read the Composer init file, whose name is the value of *composer-init-filename*. The initial
value of that variable is "~/.comp2init.cl". The Start Composer menu
command on the Emacs ACL/Composer menu calls start-composer with
read-init-file true. If an error is encountered
reading the Composer init file, reading stops and the error message is
printed but no error is signaled (just as with the
.clinit.cl file). If you wish to debug the error,
load the file after Composer has started.
You interact with Allegro Composer using Emacs menus, particularly the ACL/Composer menu. Once Allegro Composer is started, the items in that menu will be available.
The function composer-initialized-p returns true after Composer starts.
You may wish to start Allegro Composer automatically whenever Allegro
CL is started, perhaps by putting the form
(composer:start-composer) (perhaps with additional
arguments) in your .clinit.cl
file. That works but has the annoying side effect of
printing several lines of bogus warnings.
You can avoid these bogus warnings by having code in your
.clinit.cl which modifies the value of *restart-init-function* in
such a way that Allegro Composer is started when that variable is
processed (which is at the end of the startup process). Do this by
putting the following form in your .clinit.cl
file:
(defun start-composer-from-clinit-file ()
  (let ((initial-restart-init-function *restart-init-function*))
    (cond (initial-restart-init-function
            (setf *restart-init-function*
                  #'(lambda ()
                      (composer:start-composer)
                      (setf *restart-init-function*
                            initial-restart-init-function)
                      (funcall initial-restart-init-function))))
           (t
             (setf *restart-init-function*
                   #'(lambda ()
                       (composer:start-composer)
                       (setf *restart-init-function* nil)))))))

(start-composer-from-clinit-file)
Note that the value of *restart-init-function* is restored after
Allegro Composer is started.
Allegro Composer works using Emacs menus. (Most Allegro Composer functionality is unavailable if you are not running Allegro CL as a subprocess of Emacs using the Emacs-Lisp interface. See eli.htm for general information on the Emacs-Lisp interface.)
There are a number of Emacs menus associated with Allegro CL that are submenus of the ACL menu, including File, Edit, Debug, and Composer. When Allegro Composer is started, the ACL/Composer Menu items become available. (More precisely, before Allegro Composer is started, only the Start Composer item is available. After Allegro Composer is started, that item becomes unavailable, and the remaining items become available.
Allegro Composer needs the X window system and Emacs to be running to work. If there is a problem starting up, an error message should be printed. Please see Appendix B Problems starting Allegro Composer for discussion of possible errors.
You stop Allegro Composer by choosing the Exit Composer/Common Windows item from the Emacs ACL/Composer menu or by calling stop-composer function. As the menu choice indicates, Common Windows is stopped along with Composer when the menu item is chosen. stop-composer has an argument that allows Common Windows to continue running after Composer is stopped.
Common Windows is an old windowing system no longer supported by Allegro CL but still used by Allegro Composer. It will not be further discussed in this manual.
The most common errors caused by user action when running Allegro Composer are the usual Lisp errors you (may) see from time to time: typing mistakes that lead to unbound variables or undefined functions, leaving a quote out when it is needed or supplying one when it is not, or supplying a value of the wrong type.
Because almost all Composer input is via the Emacs minibuffer, such
errors are caught by the Emacs-Lisp interface, which prints a message
to the Emacs minibuffer explaining what was done wrong, but does not
cause a Lisp error to be signaled. For example, choosing the
Composer/Clos/Inspect Class menu item prompts you in the minibuffer
for the name of a class to inspect. Entering
'stream results in this message being displayed in
the minibuffer:
Cannot inspect 'stream: (quote stream) is not a legal class name
Since the value typed to the minibuffer is not (in this case) evaluated, there should be no quote.
Another problem you may run into is choosing a Composer command (from the ACL/Composer menu) that requires use of the Emacs minibuffer while the minibuffer is already in use. For example, enter the Emacs command to read a file into a new buffer (C-X C-F is the typical key combination for doing that) and, without specifying a file, choose the Inspect menu command from the ACL/Composer menu. (That command prompts for something to inspect in the minibuffer.) A message is printed to the minibuffer that an attempt was made to use the minibuffer while it was in use, but again no Lisp error is signaled.
Composer errors do occur, usually because of an improper argument to a Composer function. Resetting out of these errors (using :reset) is the usual course.
Other problems. The following is a list (by no means exhaustive) of things that may go wrong and what may be done about them.
However, if mouse clicks worked and then suddenly stop working, that is likely not the cause. More likely is something has grabbed the mouse and that something must be cleared before Composer can respond.
It may be that Allegro CL is garbage collecting or that the system is very loaded, in which case waiting will typically solve the problem.
Do not stack mouse events (that is do something new before the previous thing has completed). This can confuse the event handler.
These variables either store information about Allegro Composer or are set to useful values during execution.
*c*: this variable
provides a temporary location for values. Some menus include the command
Set *C* to object, providing a useful way to get a handle on displayed
values.
*composer-init-filename*:
the name (and typically the path) of the initialization file read when Composer starts.
*composer-title-and-version*:
a string providing version information.
After Allegro Composer is initialized, most input comes from the mouse and the Emacs minibuffer and information is displayed either in Composer windows or, occasionally in the minibuffer. You need not, in general, evaluate forms or issue commands in Lisp to get Allegro Composer to do things. An exception is the windowized debugger, which can only be displayed with the top-level command :wdebug, and other utilities (such as the windowized inspector) have functional or top-level command equivalents.
A big advantage of using the mouse, and an advantage that Allegro Composer depends upon, is the ability to denote things by pointing to them. If you are able to point to something, you need not know how to denote it in another way. Allegro Composer is set up to display things which it can act upon. Almost all Composer windows list things (processes, values, frames, local variables, etc.) which you can act on in some way.
We have tried to make Allegro Composer easy to use. The quickest way to figure out what the various tools and utilities do is to try them. If you start playing with the system in order to find out its capabilities, keep the following things in mind:
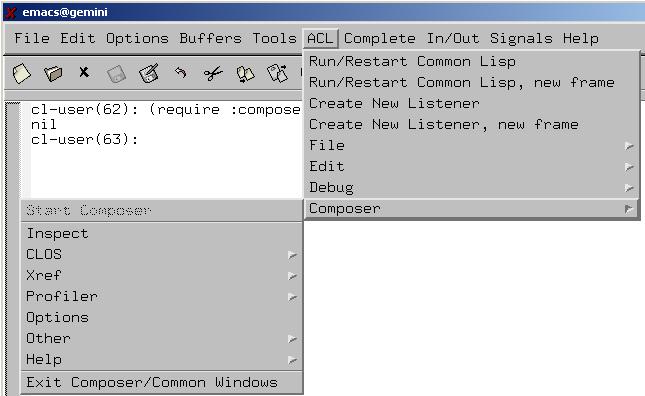
The Composer menu is a submenu of the ACL MENU on the Emacs menu bar. Before Allegro Composer is started, only the Start Composer item is available (active). The various items that display submenus are available in the sense that mousing on them displays the submenus, but all items that are commands (rather than displaying submenus) are unavailable.
Once Allegro Composer is started (by choosing the Start Composer menu item or calling start-composer), the menu changes so that the Start Composer item is unavailable and the remaining items are available. At that point the menu looks like this:

We describe each item (and its associated submenu if it has one) in the next series of subsections.
Choosing this item prompts the user in the Emacs minibuffer for an
object to inspect. That object is then inspected in an Inspector
window. What is entered in the minibuffer is evaluated. Thus, if you
want to inspect, say, the symbol mysymbol, enter
'mysymbol in the minibuffer.
If you decide that you do not want to enter an object to be inspected, enter the keyboard quit Emacs command (typically C-g).
The system tries to determine a suitable default value as the object to inspect based on the Emacs cursor location.
If there is a problem inspecting the object entered in the minibuffer
(for example, if you enter mysymbol without a quote
and mysymbol does not have a value), a message
explaining the problem is displayed in the minibuffer but no error is
signaled.
A new Inspector window is created each time the Inspect menu item, is chosen.
The top-level command :winspect and the function winspect also display Inspector windows.
See Section 5.1 Inspector windows and their menus for a description of Inspector windows.
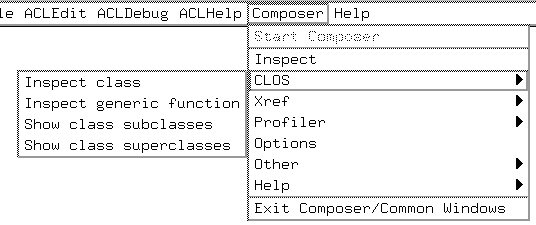
The CLOS submenu (displayed when the Composer menu is visible and the
mouse cursor is over CLOS) contains items that display
Inspector windows for inspection of classes and generic functions and
graph windows displaying class hierarchies. When you choose an item
from the submenu, you are prompted in the Emacs minibuffer for a class
or generic function name (which is not evaluated, so to enter, for
example, the class stream, enter
stream with no quote).
The system tries to determine a suitable default value based on the Emacs cursor location.
If you decide after choosing a menu item to cancel the command, enter the keyboard quit Emacs command (typically C-g).
If there is a problem with what you enter in the minibuffer (for
example, what you enter does not name a class or generic function, or
you enter 'stream -- with a quote -- rather than
stream), a message explaining the problem is
displayed in the minibuffer but no error is signaled.
The submenu items are:
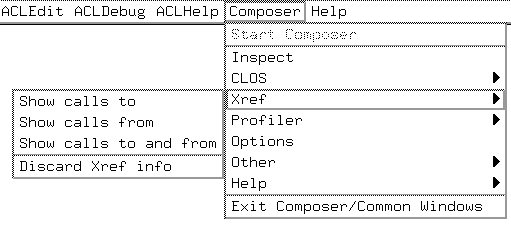
The Xref submenu (displayed when the Composer menu is visible and the
mouse cursor is over Xref) contains items that display
graph windows showing calls to and/or from a function and an additional item that
discards Cross Reference data. Choosing an item that displays a graph
causes you to be prompted in the minibuffer for a function name
(which is not evaluated, so to enter, for
example, the function my-function, enter
my-function with no quote).
The system tries to determine a suitable default value based on the Emacs cursor location.
If you decide after choosing a menu item to cancel the command, enter the keyboard quit Emacs command (typically C-g).
If there is a problem with what you enter in the minibuffer (for
example, what you enter does not name a function, or
you enter 'my-function -- with a quote -- rather than
my-function), a message explaining the problem is
displayed in the minibuffer but no error is signaled.
See cross-reference.htm for details of the Allegro CL cross-reference utility. The graphs displayed by this submenu are based on the database of cross-reference information collected by the cross-reference utility. See also Section 6.2 Cross reference browsers.
The submenu items are:
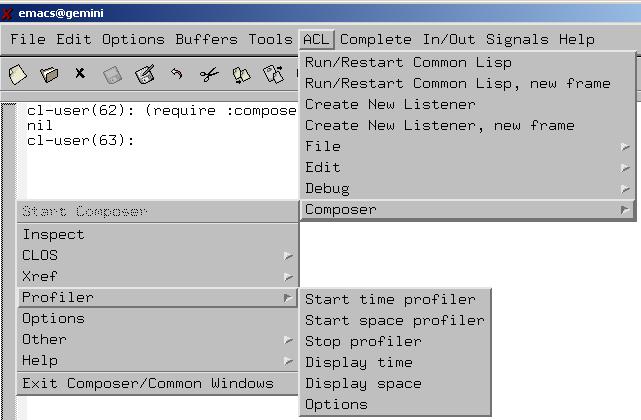
The Profiler submenu (displayed when the Composer menu is visible and the mouse cursor is over Profiler) contains items that allow starting and stopping of the Allegro CL time and the space runtime analyzers, displaying runtime analysis data, and displaying a dialog of runtime analyzer options. See runtime-analyzer.htm for information on the Allegro CL runtime analyzer.
The submenu items are:
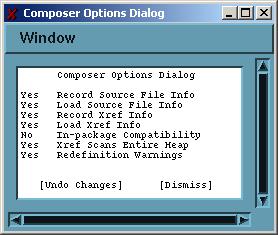
Choosing this item displays the Composer Options Dialog pictured above. This dialog allows setting of certain options related to Allegro Composer. All options can be set Yes or No and clicking on an option value toggles it to the other value (thus clicking on Yes toggles it to No). A change is effected as soon as a value is toggled. Choosing [Undo Changes] (at the bottom) restores all values to what they were when the dialog was first displayed.
The Window menu on the menubar has three choices:
Record Xref
Info
option is associated with the variable *record-xref-info*. If you
change the value of that variable in the Emacs Listener Buffer, the change will be seen
only when you choose this item.)
The options are:
Record Source File Info: Yes or No as the
variable *record-source-file-info* is true or nil.
Load Source File Info: Yes or No as the
variable *load-source-file-info* is true or nil.
Record Xref Info: Yes or No as the
variable *record-xref-info* is true or nil.
Load Xref Info: Yes or No as the
variable *load-xref-info* is true or nil.
In-Package Compatibility: Yes or No as the
variable *cltl1-in-package-compatibility-p* is true or nil.
Xref Scans Entire Heap: this option is not
associated with an exported variable, but rather an internal one. If
the value is Yes, cross reference graphs (displayed by the
Xref submenu)
include information gathered by scanning code-vectors in the heap as
well as the cross reference database. Compare the display when
Xref/Show Calls To is chosen for the function
cons when this option is Yes (a very big
display) and No (typically little or nothing is displayed).
Redefinition Warnings: Yes or No as the
variable *redefinition-warnings* is true or nil. Note that changing from No to Yes
changes the value of the variable from nil to
t. However, the initial value is typically a
list indicating what kind of redefinition warnings are desired.
At the bottom of the dialog are the commands [Undo Changes] (which restores values to what they were when the dialog was first displayed) and [Dismiss] (which closes the dialog).
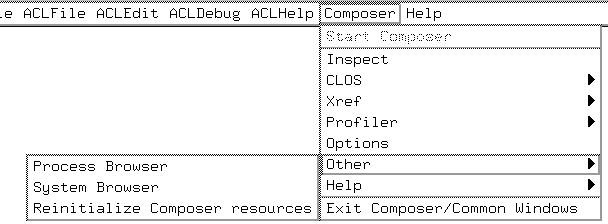
The Other submenu (displayed when the Composer menu is visible and the mouse cursor is over Other) contains two items that display Composer Browsers and one item that reinitializes X resources.
The items are:
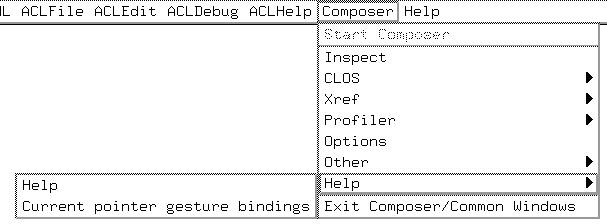
The Help submenu (displayed when the Composer menu is visible and the mouse cursor is over Help) contains two items that display useful information about Allegro Composer.
The items are:
*Composer Help* Emacs buffer.
*Composer Gesture Bindings* Emacs buffer, the
current list of logical gestures (the association of mouse keys or
mouse key/shift key combinations) and actions, as described further
just below.
Here is a sample display when Current pointer gesture bindings is chosen:
The current logical gesture definitions are:
 :select            on Left.
 :inspect           on Control-Left.
 :describe          on Shift-Left.
 :edit              on Middle.
 :menu              on Right.
 :secondary-menu    on Shift-Right.
See Section 3.3 Gestures and presentations for a discussion of gestures.
Choosing this item exits Allegro Composer, just as calling stop-composer does. It also exits Common Windows, a windowing system no longer supported but still used by Allegro Composer. (If you wish to stop Allegro Composer while leaving Common Windows running, you can do so using stop-composer.) After this item is chosen, all items that are associated with actual commands (rather than just display submenus) on the Composer menu become unavailable except Start Composer.
The way a Lisp object is displayed in a Composer window and the effect of mouse actions on that object are controlled by the presentation system and the defined gestures. A presentation controls how an object is printed or displayed, and which commands can be applied to it (e.g. with the mouse). Generally, users of Allegro Composer need not concern themselves with presentations since they simply see the object (more precisely, a printed representation of the object, in a window.
Gestures, also called logical gestures, are more important. Because we
cannot specify how you should configure your window manager (detailing
which mouse button/keyboard combinations should do what where), we
refer to mouse actions on presentations by abstract gestures
identified by keywords: :menu,
:inspect, etc. (a complete list is given
below). There is a mapping from mouse/keyboard actions to gestures and
you can define the mapping which best suits your purposes.
The following gestures are defined in Allegro Composer:
:select:inspect:describe:edit:menu:secondary-menu
The current mapping from mouse/keyboard actions to gestures is printed
in a *Composer Gesture bindings* Emacs buffer when
you choose Current Pointer Gesture Bindings from
the Help submenu of the Composer menu.
Typical contents are:
The current logical gesture definitions are:
 :select            on Left.
 :inspect           on Control-Left.
 :describe          on Shift-Left.
 :edit              on Middle.
 :menu              on Right.
 :secondary-menu    on Shift-Right.
In the description, Left, Middle, and Right refer to mouse buttons (we
assume a right handed mouse) and Control and Shift refer to keyboard
keys. Thus to perform the :inspect gesture, hold
the Control key down and click the left mouse button. The other keys
typically used (but not in the list above) are Meta, Hyper, and
Super. Double clicks are supported and are called
Double-[button], e.g. Double-Left.
Using the mouse, you can perform a variety of actions on a mouse-sensitive object printed or drawn in a Composer window. Each action is a command. A large number of commands are defined by Allegro Composer. Some commands (such as Inspect and Describe) are applicable to any Lisp object, while others are applicable only to objects of some limited types or which otherwise satisfy some criterion. For instance, Process Kill is applicable to any process but Process Unarrest is applicable only to processes which are arrested. Allegro Composer dynamically computes the commands applicable to the object under the mouse. Indeed, having at least one applicable command is what makes the presentation of an object mouse sensitive in the first place.
A command will be available only if it is appropriate to the object and is included in the command set of a particular tool. However, with some exceptions, any generally useful command will be available with any tool. For example, the various specialized commands which operate on processes are available not only in the Process Browser but on a process object displayed, say, in an Inspector window.
Nonetheless, for purposes of organization, we usually document commands on specialized objects in the section on specialized tools concerning them. Thus, commands on processes are documented in Section 6.4 The Process Browser.
When the mouse is over a mouse-sensitive object in a Composer window,
the :menu gesture will pop up a menu of applicable
commands. Clicking a command will execute it.
Frequently commands will also be available on particular gestures. The
gestures are identified on the menu (in abbreviated form). Here is the
menu displayed by the :menu (usually clicking
right) on an object in an Inspector window:
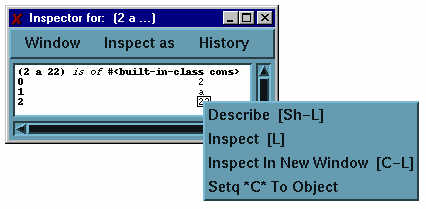
The first three choices have associated gestures --
Describe (Sh-L = Shift-Left),
Inspect (L = Left),
Inspect in New Window (C-L = Control-Left).
You can change a gesture binding with the following macro
(named by the unexported symbol excl::define-gesture-name).
Arguments: gesture-name &key button shifts action unique
The macro returns gesture-name after (re)defining
the button and keyboard combination associated with
gesture-name. The value of
gesture-name must be a keyword naming a gesture
(i.e. :inspect, :menu, etc.)
The value of the button must be one of
:left, :middle,
:right, :double-left,
:double-middle, or
:double-right. The double- means
a double click is required. A value must be supplied for this
argument. There is no default.
The value of the shifts must be either nil (the default); or one of the symbols
:shift, :control,
:meta, :hyper, or
:super; or a list of one or more of those symbols
(note: the argument is not evaluated). All specified keys must be
pressed when the specified button is clicked in order to perform the
gesture.
If the unique argument is true (the default), any
previous gesture binding for gesture-name is
removed. Specifying nil permits defining a
logical gesture with multiple bindings.
For example:
;; When the following is evaluated, the :inspect gesture will
;; be performed by clicking the middle button while holding
;; down the Control key:
(excl::define-gesture-name :inspect :button :middle
                           :shifts :control)
Menus are an important part of Allegro Composer, typically providing a list of options suitable to the location and situation of the mouse and the state of Lisp and Composer.
Some menus are on menu bars (the Composer menu is on the Emacs menu and
most composer windows have menu bars). Other are pop-up menus displayed
by the :menu gesture (and, in graph windows, the
:secondary-menu gesture).
Menu bar menus: most Composer windows have menu bars. Clicking over a menu label displays the menu. Most windows have a Window menu, with choices Quit (close the window), Resize to Fit (resize the window to exactly fit the displayed data, if possible), and Refresh (update the data displayed in the window).
Menus over objects. Many objects in Composer windows are mouse
sensitive, meaning some command can be performed on the object with a
gesture. Whenever an object in a Composer window is mouse-sensitive,
the :menu gesture (usually clicking the Right mouse
button) is defined and displays a menu. In graph windows, the
:secondary-menu gesture is usually defined as well.
It is important to be sure what is selected and
mouse-sensitive. Allegro Composer indicates this by boxing. Note that
objects and parts of objects may be boxed. For example, the following
shows the display of the list (2 a 22) in an
Inspector window. In the upper image, the whole list is selected
(boxed) while in the lower image, just the symbol a
(the second element of the list) is selected.

The choices in menus over objects are usually self-explanatory. Here are some choices you will often see:
*c* to
be set to the selected object.
Background menus. many Composer windows have background menus,
displayed by the :menu gesture over the background
of a window (i.e. in a window but away from mouse-sensitive objects).
This menu is typically the same as the Window menu on the menu bar.
Menus over graph nodes and debugger items. Graph nodes are
special in the following way. They often display Lisp objects which
can be acted upon like Lisp objects displayed in other
windows. However, you may be interested in the node as a node of a
graph rather than as a container of what it displays. Because it is
complicated to distinguish between pointing to a node and pointing to
its contents, separate gestures are provided for each purpose. The
:menu gesture performed at the node of a graph
displays a menu appropriate to its contents while the
:secondary-menu gesture displays a menu with
commands applicable to the node itself. The same issue affects frames
in a Debugger window, and both the :menu and the
:secondary-menu gestures are applicable to frames
in a Debugger window.
Graph windows are used by several Composer utilities. They are used to display runtime analysis data, to display cross-reference information, and to display class hierarchies.
Allegro Composer does not correctly display non-ASCII characters in graphs.
Here is a graph displaying the subclasses
of the class stream (displayed by choosing
CLOS/Show class subclasses and entering
stream in the minibuffer).
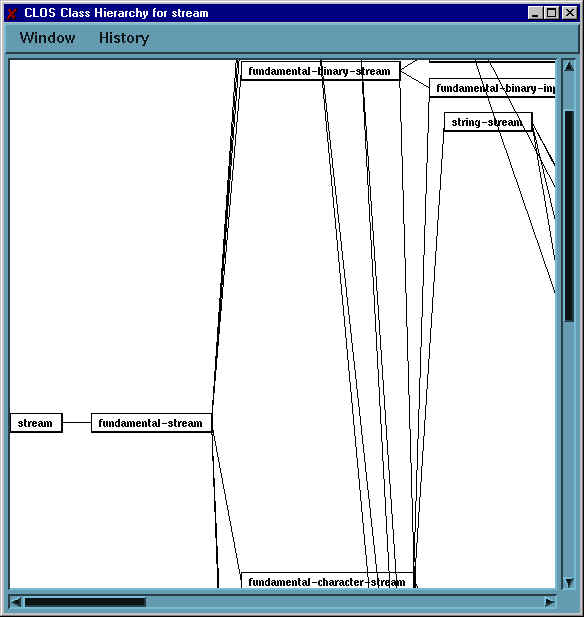
Since most graphs are larger than the window displaying them, only part of the graph is visible. You can scroll the graph about in a window in three ways: (1) with the scroll bars; (2) by dragging (described next); and (3) with the overview window.
Drag scrolling works by placing the mouse cursor in the interior of the window, but away from any node, and pressing the left or middle mouse button and dragging the mouse. The graph will move in concert with the mouse cursor.
The overview window is displayed when you choose Show
Overview from the Window menu on the menu bar of a graph
window. The overview window of the stream subclasses window shown
above is shown here:
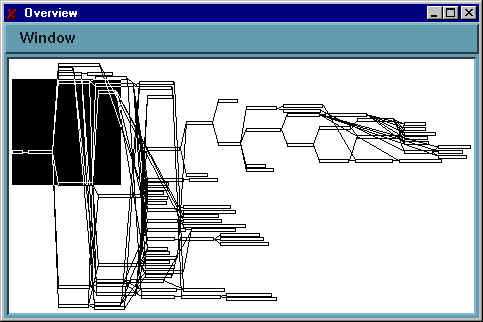
The whole graph is visible (though the nodes do not display any information). The area currently displayed is shaded. Clicking any mouse button over a location in the overview window scrolls the associated graph window so the location clicked on is (roughly) in the center of the graph window.
The menu typically contains the following commands:
stream defined since the graph was
originally displayed, for example).As described in Section 3.5.6 The :secondary-menu gesture over a graph node, you can display derived graphs that leave out specific subtrees or just display specific subtrees, etc. Each such derived graph is added as an item on the History menu. Choosing that item replaces the graph display with the derived graph. Graphs are typically named by their root (leftmost) node (perhaps with more information). The item on the menu corresponding to the currently displayed graph is grayed out.
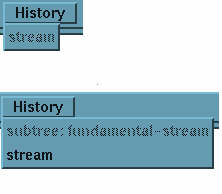
When the graph first appears, the only entry on the History menu is
the graph itself. Derived graphs are added as they are displayed. The
image below shows the History menu for the stream subclasses graph
when it is created (the only entry is labeled
stream) and then the History menu after the derived graph
containing the fundamental-stream subtree (labeled
subtree: fundamental-stream) is displayed.
Note that choosing Recompute Graph from the Window menu destroys all derived graphs.
The :menu gesture over a node displays a menu
applicable to the object displayed in the node, with the additional
choice Menu of graph commands, which displays the
menu associated with the :secondary-menu gesture
over the node. See the description of that menu below.
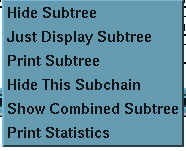
The :secondary-menu gesture over a node displays a menu
of choices which will display derived graphs. Typical choices include:
stream node,
a new node labeled standard-object appears as
stream's parent.
Find Node(s) From Name is a choice in the Window menu on the menu bar of a graph window. When you choose this item, the following happens:
undamental-st from
fundamental-stream, e.g.) of the desired name, just
as with apropos.
The debugger in Allegro Composer uses both Emacs buffers and Composer windows to display information about broken processes. It utilizes the Allegro CL facilities for evaluation in context and for separate listeners.
The debugger functionality provided is not significantly different from that described in debugging.htm. What Allegro Composer adds is enhanced display of debugging information and the ability to identify and manipulate objects by pointing to them with the mouse.
You may note there is no item on the Composer menu corresponding to the debugger. That is because debugging facilities in Allegro Composer are only available when a Lisp process is in a break loop. Debugger windows are displayed with the top-level command :wdebug. Debugger windows display a stack backtrace (a zoom, displayed in a listener with the :zoom top-level command).
Debugging background processes (broadly, processes not set up to receive typed input) in special listener buffers occurs automatically, as described in Debugging background processes in debugging.htm. Note that this is a Lisp rather than a Composer feature.
You can create a debugger window for a broken process by entering the command :wdebug to the listener for that process.
The window displaying the backtrace is called a debugger window. Clearing the error in the listener (using e.g. :pop or :reset) will cause the associated debugger window to be closed, as does clearing the error using the appropriate item in the Debugger menu on the debugger window also closes the window. But note that closing the window (by choosing Quit from the Window menu or clicking on the Close button) does not clear the error.
Here is the debugger window displayed when an undefined function
badfun is called.
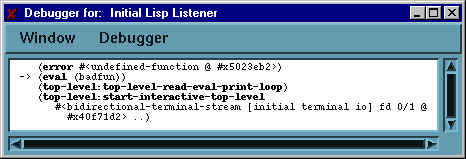
Note the following about this window:
:secondary-menu
gesture over the frame).
->.
Debugger windows inherit the values of *print-level*
and *print-length* from the listener to which the
:wdebug command was typed. If the
system determines the values are inappropriate, it will select
appropriate values and print a message to that effect to the
listener.
If another error occurs in the listener associated with a Debugger window, the Debugger window is not changed or updated. You should enter the :wdebug command again, which will cause the current Debugger window to be closed and a new one to be created.
The frames and some of the contents of frames are mouse-sensitive. The subsections that follow describe menus and mouse actions in debugger windows.
This menu contains the usual Window menu entries. The same entries are
on the background menu, displayed with the :menu
gesture over a non-mouse-sensitive piece of a Debugger window (note that there are few
places in a Debugger window that are not mouse-sensitive).
The Debugger menu has choices which affect the broken process as well as the Debugger window itself. The choices depend on the state of the window. The two possibilities are illustrated next.
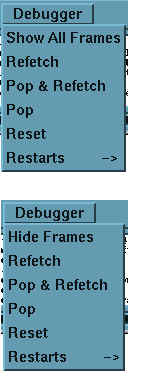
:all
t
. All frames, including those normally hidden, are
displayed. This choice is only available when frames are hidden.
:all
nil
. Frames normally hidden are hidden. This choice is only
available when all frames are shown.
When you perform the :secondary-menu gesture over a
frame in a Debugger window, a menu of commands appropriate to the frame
appears. The exact contents of the menu depends on the state of the
Debugger window. The illustration below is the menu as
soon as the Debugger window appears. To display this menu, the cursor
must be over the frame, but the frame itself need not be selected
(boxed). The :secondary-menu works even if
something in the frame is selected (boxed).
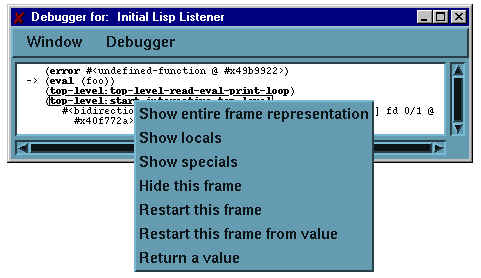
The choices are:
save-local-names-switch). To get rid of
locals, choose Hide locals from the (modified) menu or choose
Refetch from the Debugger menu.
Performing the :menu gesture over a frame displays
a menu of commands on the frame. Note that the entire frame must be
selected (boxed) for Composer to treat the frame as the object being
pointed to (there are menus for objects represented in frames as
well). The menu displayed is illustrated below.
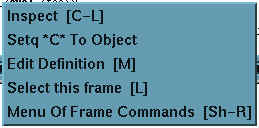
*c* to the frame object.
:secondary-menu gesture over the frame. That menu
is described in Section 4.1.3 Menus over frames 1: the :secondary-menu gesture menu.
The objects displayed in a Debugger window are presentations upon which gestures can be performed. When the mouse is over an object on which a gesture can be performed, that object is boxed. We described the menu over frames in the previous section and the menu over locals in the next section.
Consider the function bar:
(defun bar (x y)
  (break)
  (+ x y))
We evaluate (bar 1 2) and display a Debugger window.
We have locals displayed because we have chosen Show locals from
the
:secondary-menu gesture over the frame (see
Section 4.1.3 Menus over frames 1: the :secondary-menu gesture menu). The local Y is boxed.
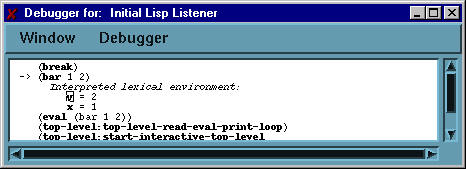
When you perform the :menu gesture over a local,
the menu displayed has choices:
*c*.
The window-based inspector allows the user to examine the internals of
any Lisp object. Many Composer windows present Lisp objects and allow
you to inspect those objects using the :inspect
gesture.
Inspector windows maintain a history of objects inspected. You can use the mouse to choose elements from that history for display in the window. Providing a history mechanism prevents a proliferation of inspector windows.
There are five ways to bring up an Inspector window:
:menu gesture. In this case, the object to inspect is
the object being pointed to.
:menu
gesture includes an Inspect item, the :inspect
gesture (usually Control-Left) has the same effect as choosing Inspect from the menu.
The illustration below shows an Inspector window inspecting (cons 1 2).
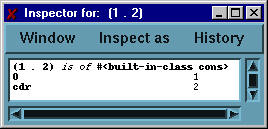
The window has a title bar, a menu bar (with menus Window, Inspect as, and History), an interior (displaying the information) and scroll bars (not currently active).
The interior of an Inspector window has one or two header lines (only one in the illustration) identifying the object being inspected, and, below the header lines, two columns. The one on the left is the labels column and the one on the right the values column. (Note that zero, one, or more values may appear next to a single label though one value is most common.)
In the illustration, the one-line header line says (1 .2) is
of #<built-in class cons>. Only two lines are
allocated for header lines. Suspension points (...) are used if two
lines are insufficient, to indicate missing material. If you want to
see more, make the window wider (using window manager tools) and
choose Refetch from the Window menu. Note that choosing
Resize to Fit usually does not work for this purpose.
In the next illustration, we show the result of choosing Inspect from
the Composer menu and entering (find-class 'stream)
in the minibuffer. Note that this window is organized somewhat
differently than the one illustrated above: instead of there being a
column of labels and a column of values, the description is more
discursive. This style of presentation is thought more useful for CLOS
classes, and so it is used by default when a class is being
inspected. The Inspect as menu (which we describe
in more detail below in
Section 5.1.2 The Inspect As menu on an Inspector window) shows
different presentation styles. The one in the window is the
std-class style. If you select the
t, the window will redisplay in the label
column/value column format.
Note too about the Inspector window for the stream class that the
display is complete (because the scroll bars are not active) but none
of the 17 methods mentioned at the bottom are displayed. 17
methods is mouse sensitive and choosing Inspect from the
menu displayed by the :menu gesture will inspect
the methods.
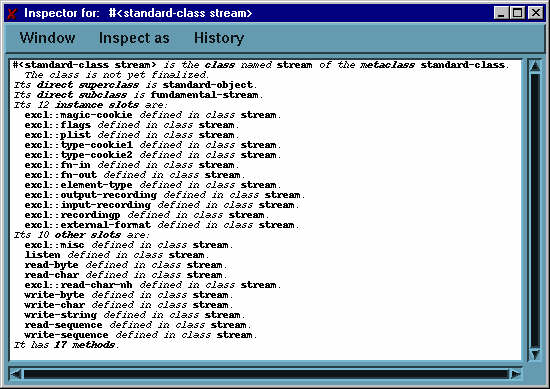
In an Inspector window, you can (1) display an inspection of an object displayed; (2) set the value of (most of the) slots, and (3) change the method of inspection.
Using the :select gesture (typically clicking Left)
over an object causes it to be inspected in the same window (previous
inspections are available using the History menu). The
:inspect gesture (typically clicking Control Left)
brings up a new window. We recommend using the
:select gesture to reduce the number of windows.
Using the :select gesture (typically clicking Left)
over a label (actually, the label and the value are boxed) prompts you
in the minibuffer for a new value and replaces the current value with
the new one.
When the value column has no entry for a label, it means the slot
named by the label is unbound. It does not mean that the value is
nil or, say the empty string "". Symbols
without a value have an empty value slot, for example.
In some cases a label has more than one corresponding value. This is
an artifact of the presentation style: you can inspect a 2-d array (as
returned by (make-array '(2 2) :initial-contents '((1 2)(3
4)))) as a 2-d matrix, with two labels indicating rows and
having two values or as a vector with four labels with one value each.
You can select each individual value and modify it. If you select the
label and call for a new value, only one value is accepted and one
changed.
The Window menu has these choices:
The background menu, displayed with the :menu gesture
over a non-mouse-sensitive portion of the interior of an Inspector window,
has the same contents as the Window menu.
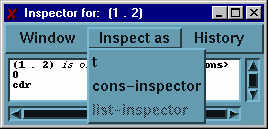
The contents of this menu are determined by the inspected object. The
choice t will always be present and there may be
other choices as well.
The illustration shows the contents of the menu when inspecting a
cons. The choices are t,
cons inspector, and list
inspector. The choices affect what labels are used, and how
the values are grouped.
This menu keeps track of the history of inspections in the window. The printed representation of the object inspected is presented as a menu selection. The currently inspected object is masked. The purpose of this menu is to reduce the number of windows in use by using a single window many times.
The :menu gesture over a label of a settable slot
(not all slots are settable) in an inspector window displays a menu
with two choices:
*c*.
The :menu over a value will display a menu of choices
suitable for that value.
A browser is a tool to examine some aspect of the Lisp system. Allegro Composer provides browsers for CLOS classes, cross reference information, systems defined with defsystem, and processes.
The CLOS submenu (see Section 3.2.2 The CLOS submenu)
of the Composer menu includes items Show Class
Superclasses and Show Class
Subclasses. When you choose either of these items, you are
prompted in the minibuffer for a class name (which is not evaluated).
See Section 3.5 Graphs for information on graphs.
The Xref submenu (see Section 3.2.3 The Xref submenu)
of the Composer menu includes items Show Calls To,
Show Calls From, and Show Calls To and
From. Only compiled functions add information to the cross
reference database, and information is only added if *record-xref-info* and (when
loading a fasl file) *load-xref-info* are true (but see the comment
next on the Xref Scans Entire Heap option).
The cross reference facility (on which the graphs are based) is
described in cross-reference.htm. Note that more
information may be displayed in the Cross Reference graphs (if the
option Xref Scans Entire Heap is on, see
Section 3.2.5 The Options menu item) than cross reference
data displayed in a listener. The latter only displays cross reference
data collected from user files. The former (when the option is on)
scans all compiled code vectors and thus finds much more
information.
See also Section 3.5 Graphs for information on graphs.
A defsystem browser will be displayed when you choose
Other/System Browser from the Composer menu. All
systems are defined by the defsystem utility described in
defsystem.htm.
Consider the following simple example. There are four files:
;; filea.cl

(in-package :user)
(defun funa () 'yow)

;; fileb.cl

(in-package :user)
(defun funb () 'wow)

;; macros.cl

(in-package :user)
(defmacro this-is-a-macro (x) '(+ ,x ,x))

;; not-macros.cl

(in-package :user)
(defun use-macro (x)
  (this-is-a-macro x))
The file sys.cl defines three systems:
(in-package :user)

(defsystem :my-system ()
  (:parallel "filea" "fileb"))

(defsystem :my-other-system ()
  (:definitions "macros" "mot-macros"))

(defsystem :my-super-system ()
  (:serial :my-system :my-other-system))
Load sys.cl and choose Other/System
Browser from the Composer menu. The following window is
displayed (assuming you do not already have systems defined. If you
do, they will also be listed.)
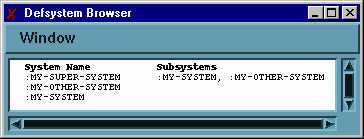
The Window menu on the menu bar has the following choices:
Applying the :menu gesture over a system displayed in the browser
(in either column) displays the menu shown here.
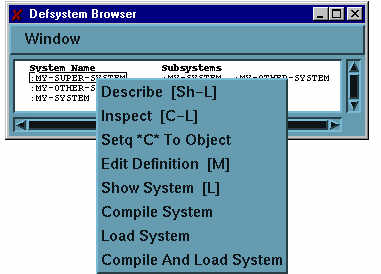
It has the following choices:
*c* to the the indicated system object.
Choosing Other/Process Browser from the
Composer menu displays the Process Browser, which contains information
about processes (or threads) currently running. (See
multiprocessing.htm for information on processes
and threads.)
The Process Browser is illustrated below. This window is regularly automatically updated.
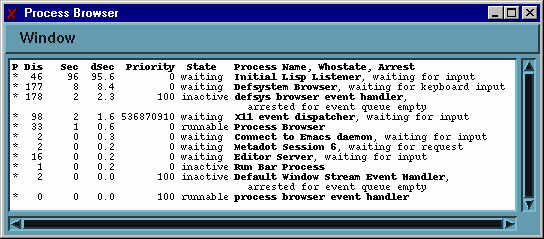
The header line at the top of the interior of the window labels the columns of information. These headings are the same as those printed by the :processes top-level command. They are:
The Process Browser has a Window menu on its menu bar. The choices are:
nil to suppress automatic updating. When the window is not
updated automatically, you can update manually be choosing Refresh.
Only processes (the whole line, not any part) are boxed as you move
the mouse about the interior.
The menu displayed by the :menu gesture over a process is shown next.
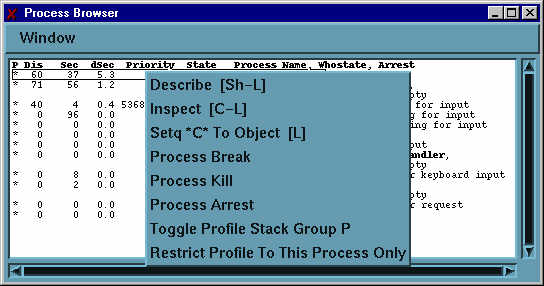
*c* to the the indicated process object.
Runtime analysis using profiling in Allegro CL is described in runtime-analyzer.htm. There are space and time analyzers (as well as a call-counting profiler which has no window interface). The window interface described here is most useful for examining runtime analysis data. You can start and stop data collection with items on the profiler menu (see Section 3.2.4 The Profiler submenu) but you cannot suspend it, as you can with the functional interface.
Here is an illustration of the profiler submenu.

The items are described in Section 3.2.4 The Profiler submenu. Here we just discuss the Options choice. When you choose Options, the following dialog is displayed:
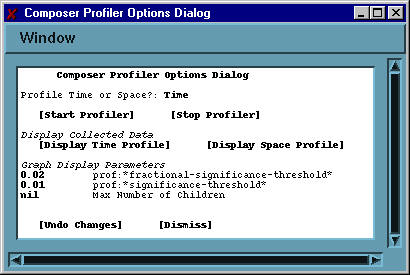
The Profile Time or Space option is set to
time. Click on it to change it to space. Only one of [Start
Profiler] (which starts data collection of the indicated type) and
[Stop Profiler] is active, as the data collection is or is not
occurring. The [Display Time Profile] and [Display Space
Profile] are active only when there is data of the appropriate
type to display. Note that items on the Profiler menu allow starting
the time and the space data collection, and stopping them, and displaying
data.
Two of the display parameters are associated with runtime analyzer
variables, *fractional-significance-threshold* and
*significance-threshold*. You can set the
values by clicking on the current value, at which point you are
prompted in the minibuffer for a new one. Max Number of
Children specifies the value of an internal variable that controls
the maximum number of child nodes a node in a graph may have. nil means no restriction. A change made to a value
immediately changes the associated variable's value.
[Undo Changes] restores values to what they were when the dialog was first displayed. [Dismiss] closes the dialog.
Runtime analyzer profile graphs are similar in most respects to other
Composer graph windows described in
Section 3.5 Graphs but they do have some
additional features. Let us consider an example. First display the
Process Browser (choose Other/Process browser from
the Composer menu. Click right (the :menu gesture
over the Initial Lisp Listener process and choose Restrict Profile
To This Process Only (this will reduce the amount of extraneous
data). Start the time runtime analyzer profile by choosing
Profiler/Start Time Profiler and evaluate
(pprint (list-all-packages)) in the listener. When
that form completes, stop the data collection by choosing
Profiler/Stop Profiler. Finally choose
Profiler/Display Time. A window similar to this
should appear.

Note the several double-headed arrows (<=>). These indicate elisions, where nodes have been left out (elided) because no significant time was used between the node to the left and the one to the right.
The first (leftmost) node is labeled start
100%. This node does not correspond to any actual Lisp
function. It is simply the root of the graph.
All boxed nodes are sensitive to the mouse and have
:menu and :secondary-menu menus
defined. As usual, the :menu is associated with the
contents of the node and the :secondary-menu
gesture is associated with the node itself and the graph. here is the
menu displayed by the :secondary-menu gesture over a node:
Allegro Composer is a standard X client. It therefore depends on standard X facilities for customization. In this appendix, we provide information necessary for using X utilities to customize Allegro Composer but it is beyond the scope of this document to describe X utilities in detail. We assume you are familiar with customizing X.
Like most X clients, Allegro Composer uses X resources for configuration. Unfortunately, different implementations of X on different machines set up resources differently. In most, however, there is a file name .Xresources which is used by X for configuration. The exact details of how this file is used are system-dependent but if the file is set up correctly when X is started, things should work as you want.
In X, tools have a name and a class. The following table shows the name and class of various Composer tools.
| Tool | Name | Class |
| debugger | composer.debugger |
Composer.Debugger |
| class graph | composer.classGraph |
Composer.Grapher |
| who calls | composer.whoCallsGraph |
Composer.Grapher |
| process browser | composer.processBrowser |
Composer.ProcessBrowser |
| defsystem browser | composer.defsysBrowser |
Composer.DefsysBrowser |
| inspector | composer.inspector |
Composer.Inspector |
| profile graph | composer.profilerGraph |
Composer.Grapher |
| listener | composer.listener |
Composer.Listener |
| profiler options | composer.profilerOptions |
Composer.ProfilerOptions |
Graph overview windows have a name/class that is the same as the graph
window name/class with `.overview'/`.Overview' appended to the
name/class. Thus composer.whoCallGraph.overview and
Composer.Grapher.Overview.
Tool resources include the following:
A resource of a particular tool is the name.resource. For
example, the font resource of the process browser is
composer.processBrowser.font.
The baseColor resource sets the tone colors of the window. It is normally a light color. The font resource specifies the default font. Bold, italic, and boldItalic fonts are derived from font unless they are also specified.
You can specify the resource values in several ways.
You can specify exact matches, as with the following specifying the font of the Defsys Browser:
composer.defsysBrowser.font -adobe-courier-medium-r-normal--12-120-75-75-m-70-iso8859-1
You can match the class and apply the resource to all tools of that class:
Composer.Grapher: -adobe-courier-medium-r-normal--12-120-75-75-m-70-iso8859-1
You can use wildcards to specify a number of matching tools:
composer*font: -adobe-courier-medium-r-normal--12-120-75-75-m-70-iso8859-1
You can specify both specific and general resources in the same file. The specific will take precedence over the general. For example, if the file contains this:
composer*background: pink
composer.processBrowser.background: purple
the background of all Composer windows will be pink except for the Process Browser. Its background will be purple.
The X resources are read by Lisp when Allegro Composer starts up. The
resources are typically read by the X server. If you change the
resources in the server (typically by modifying your
.Xdefaults file and using the xrdb utility
to load them into the server) Lisp will not see the changes unless you
choose the Reinitialize Composer Resources item
from the Other submenu of the Composer menu on the Emacs menu bar.
Stopping and restarting Allegro Composer also works.
Note that we said `typically' several times in the last paragraph. It
may be that resources are not loaded into the server but are handled
in a different fashion. If that is the case, you must adapt what we
have said to that situation. If choosing Reinitialize
Composer Resources does not work, stop Allegro Composer and
restart it.
If you start Allegro Composer from Allegro CL started with the Emacs command fi:common-lisp, so it is running as a subprocess of an Emacs displaying in a X window, you should not have any startup problems, since things should be set up in such a way that they will just work. Nonetheless, this appendix discusses potential problems.
Allegro Composer can only be started when Allegro CL was started as a subprocess of Emacs with fi:common-lisp (in that case, there will be a Lisp process that communicates with Emacs called "Connect to Emacs daemon"). If you get this error, you have likely tried to start Allegro Composer when Lisp is not running as a subprocess of Emacs or the Emacs-Lisp interface has not started. Exit Lisp and restart in Emacs with fi:common-lisp.
Allegro Composer is only available on Unix platforms. It is not
available on the Windows version of Allegro CL, and the
composer package is not defined in the Windows
version. If you see this error, it is likely you are trying to start
Allegro Composer in the Windows version. The Integrated Development
Environment, which has many tools similar to those in Allegro
Composer, is available in the Windows version.
Since Emacs should already be running in an X window (and thus knows the host information), and Composer usually inherits this information from Emacs, this error should be unusual. However, you may be specifying a value for the host to start-composer, and that value is invalid, of (for some reason) the value within Emacs has changed. You might try calling start-composer with what you know to be the right host name.
Copyright (c) 1998-2022, Franz Inc. Lafayette, CA., USA. All rights reserved.
This page was not revised from the 10.0 page.
Created 2019.8.20.
| Allegro CL version 10.1 Unrevised from 10.0 to 10.1. 10.0 version | ||||||||